
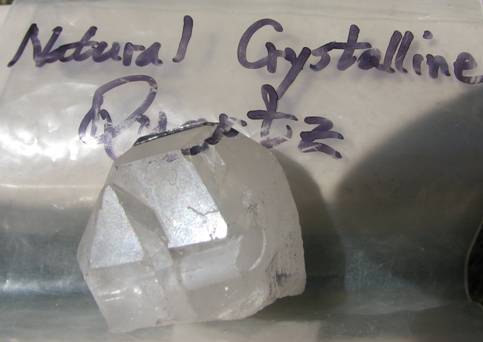
Natural Crystalline Quartz up to 1200ºC
Summary:
Dielectric constant measurements were done on single crystal, natural quartz, using cylindrical samples made by diamond core-drilling a clear, transparent, natural alpha-quartz crystal ( of unknown impurity content ). The cylindrical test samples were obtained by drilling both parallel to the c-axis and perpendicular to the c-axis.
The ε′ and ε′′ values of crystalline α-quartz ( density ~ 2.65 g/cc) are known to be anisotropic, reflecting the hexagonal crystal structure. The low frequency, room temperature, value of ε′ is slightly higher in the c-axis direction than in the direction perpendicular to the c-axis (Δε′ ~ 0.2 ±0.1 ), and has an average value of ~ 4.7 . Crystalline α-quartz undergoes a phase transition to β-quartz at ~ 573ºC which has been studied by many authors.
The values of ε′′ in the two different crystal axis directions had not been investigated previously at high frequencies and temperatures above 510ºC. The present measurements demonstrate that, at temperatures above 600ºC, the values of ε′′ along the c-axis are very much larger than the values perpendicular to the c-axis. This anisotropy extends to the very high temperature range. The loss mechanism appears to be thermally activated conduction electrons, presumably moving in the natural channels of the quartz crystal.
Methodology of the Single Crystal Quartz Dielectric Properties Measurement:
A relatively large single crystal specimen of naturally occurring clear quartz was obtained from the Bancroft region of Ontario, Canada ( see photo). The required test specimens for our cavity perturbation system ( a cylinder ~ 3.5 mm diameter and ~ 12 mm length) were obtained by diamond core-drilling the clear, transparent, natural alpha-quartz crystal, both parallel to the c-axis and then perpendicular to the c-axis ( see photos). The angles relative to the axis were within a few degrees. The samples were dried at ~ 140C for a few hours before each measurement run.
The measurement runs were done using a new GE-214 amorphous silica tube, similar to those used as test samples in the amorphous silica experiments. The single crystal test cylinders were inserted onto a thin ( ~ 1 mm ) silica base located ~ 10 cm down the tube (done by our glass-blower). In this set of experiments, six frequencies were measured ‘simultaneously’- that is, each time the hot test sample was inserted into the cavity, the frequency and Q of 6 resonance peaks were measured ( ~ 3 seconds total time for each high temperature point).
The dielectric properties measurements were performed at room temperature (RT), 50°C and then in 50C steps to 1150°C, then 1000C, then in -100C steps back down to 200C, then RT . The sample was then removed, and the empty holder measured in 200C steps up to 1100C, to determine accurate background subtractions.
Details of Individual Single Crystal Test Sample Characteristics at 20C :
1) Cylinder with Axis Parallel to C-Axis:
a) length 12.09 +- 0.05 mm
b) diameter 3.64 +- 0.05 mm
c) mass 0.334 +- 0.002 gm
d) appearance - ground glass rod, squared ends
e) room temperature density 2.65 ±0.08 gm/cc.
2) Cylinder with Axis Perpendicular to C-Axis:
a) length 12.05 +- 0.05 mm
b) diameter 3.64 +- 0.05 mm
c) mass 0.333 +- 0.002 gm
d) appearance - ground glass rod, squared ends
e) room temperature density 2.66 ±0.08 gm/cc.
The almost horizontal hole is the result of core-drilling perpendicular to the c-axis.
The pointed ‘peak’ of the sample has been sawed off to prepare for the vertical
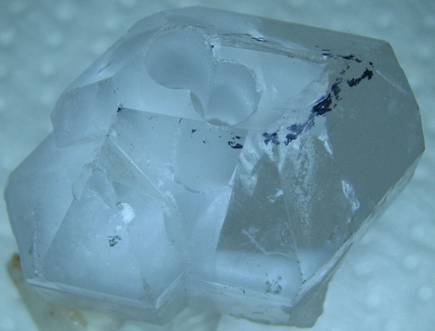
Result of two vertical core-drills, done parallel to c-axis.
Coefficients of Thermal Expansion up to High Temperatures :
Alpha quartz is the low temperature phase of crystalline silicon dioxide, having a hexagonal crystal structure, which produces an anisotropic thermal expansion coefficient.
A quote from the ‘quartz page’ outlines the temperature response of crystalline quartz :
Quartz Phase Diagram Info – from “The Quartz Page”
http://www.quartzpage.de/gen_mod.html
‘In theory, at normal pressure trigonal quartz (α-quartz) will transform into hexagonal β-quartz at 573°C, upon further heating the SiO2 will transform into hexagonal β-tridymite at 870°C and later to cubic β-cristobalite at 1470°C. At 1705°C β-cristobalite finally melts:
|
|
573°C |
|
870°C |
|
1470°C |
|
1705°C |
|
|
α-Quartz |
|
β-Quartz |
|
β-Tridymite |
|
β-Cristobalite |
|
Silica Melt |
However, tridymite does usually not form from pure β-quartz, one needs to add trace amounts of certain compounds to achieve this (Heaney, 1994). So the β-quartz-tridymite transition is skipped and the sequence looks like this:
|
|
573°C |
|
1050°C |
|
1705°C |
|
|
α-Quartz |
|
β-Quartz |
|
β-Cristobalite |
|
Silica Melt |
Quartz physical properties are well known, and generally have been studied thoroughly. However, the dielectric properties at high temperatures are not so well determined.
A distillation of the results of various authors produced the following values for the CTE, of alpha and beta quartz:
a) Parallel to C-axis: CTE ~ 11.0* 10-6 /C up to 573 C , then -3.0* 10-6 /C above 573 C .
b) Perpendicular to C-axis: CTE ~ 18.0* 10-6 /C up to 573C, then -1.0* 10-6 /C above 573C.
The dilatometry work of Urs Raz, Sven Girsperger & Alan Bruce Thompson was used as a source of measurements of the anisotropic dimensional discontinuity that occurs during the transition at 573C . These values have been incorporated into the temperature dependence of the sample dimensions used in analyzing the present data.
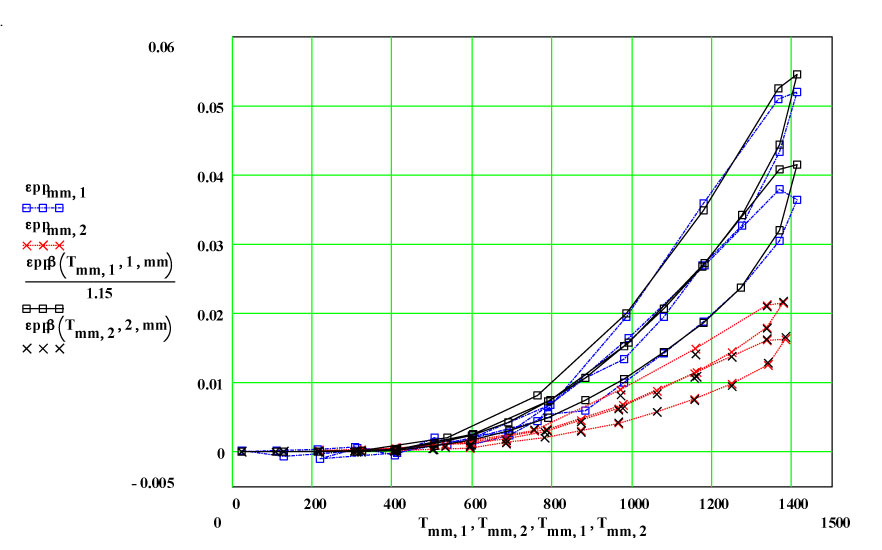
The following two plots show the percentage thermal expansion in the axial and radial directions assumed in our two measurement samples:
Sample with cylinder axis parallel to the crystal C-axis.
Percentage linear thermal expansion as a function of temperature (C) in
(1) the axial direction ( red crosses) and (2) radial direction ( blue diamonds).
The coefficient along the crystal A-axis is larger than that along the C-axis.
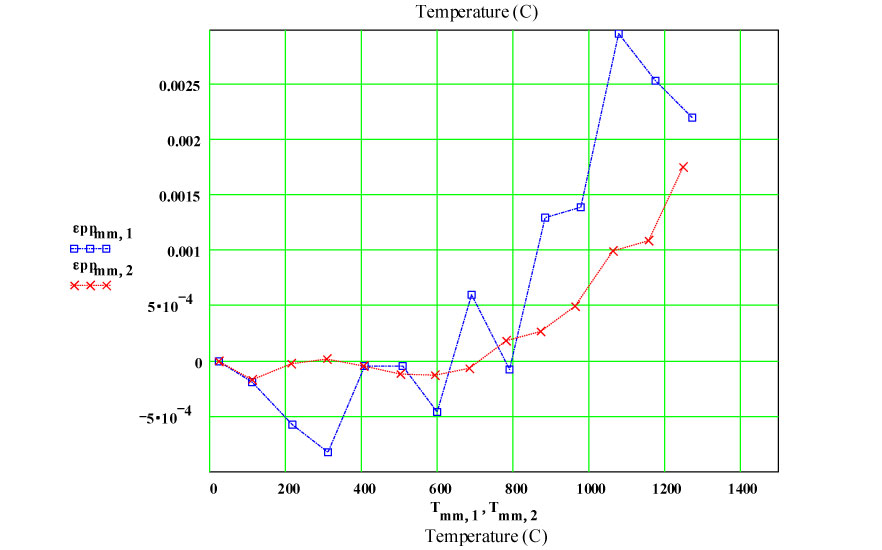
Sample with cylinder axis perpendicular to the crystal C-axis.
Percentage linear thermal expansion in (1) the axial direction ( red crosses) and
(2) average radial direction ( blue diamonds) , in sample with axis perpendicular
to the C-axis
MPN Measured Values of Quartz Dielectric Properties:
In the following data presentation, the frequencies, fh , are numbered 1 to 6, with plot coding as follows :
Legend for Data Plots :
# Frequency(MHz) Symbol
1 397 red diamond, solid line
2 912 blue square, solid line
3 1429 black cross, solid line
4 1948 blue circle, dotted line
5 2466 red cross, dotted line
6 2986 black diamond, dotted line
Crystalline Quartz Dielectric Properties Parallel to C-axis :
Crystalline Quartz Dielectric Properties Perpendicular to C-axis :
Note that the peak in equivalent conductivity at ~ 175 C on the initial run-up in temperature is not there in the run back down to room temperature. This was obviously due to some impurity that was eliminated by the heating of the sample to 1150C in air. This elimination of the impurities and consequent reduction in the low temperature loss values has been studied by E. H. Snow & P. Gibbs, J. Applied Physics 35, pg. 2368 ( 1964).
Please feel free to phone or e-mail and discuss possible measurements. We treat all communications as confidential unless advised otherwise.
Fused High Purity Silica
Initial Scoping Measurements of the ε′′ Value of GE-214 Fused Silica, Using MPN Sample Holders as Test Samples
Summary:
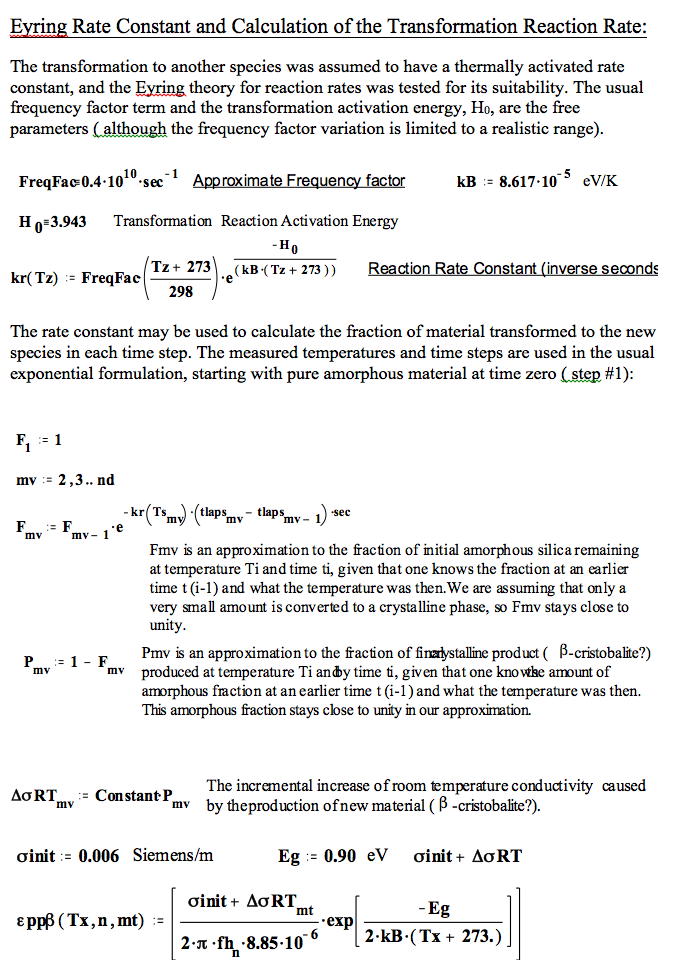
These measurements used a GE-214 Fused Silica tube as a test sample in a perturbation measurement of the dielectric loss constant at high temperatures. The measured dielectric loss factor appears to have a thermally activated dependence ( which can be interpreted as thermally activated conductivity loss), with frequency dependence close to that of free conduction electron conductivity. However, repeated cycles to 1450ºC showed that the overall dielectric loss increased by a constant factor every time the tube was cycled to 1450ºC. This may be caused by the known conversion of amorphous silica glass to β-cristobalite above 1000ºC. The high temperature dielectric loss is clearly dependent on the transformations caused by ( or new species formed by) the temperature cycling.
Introduction:
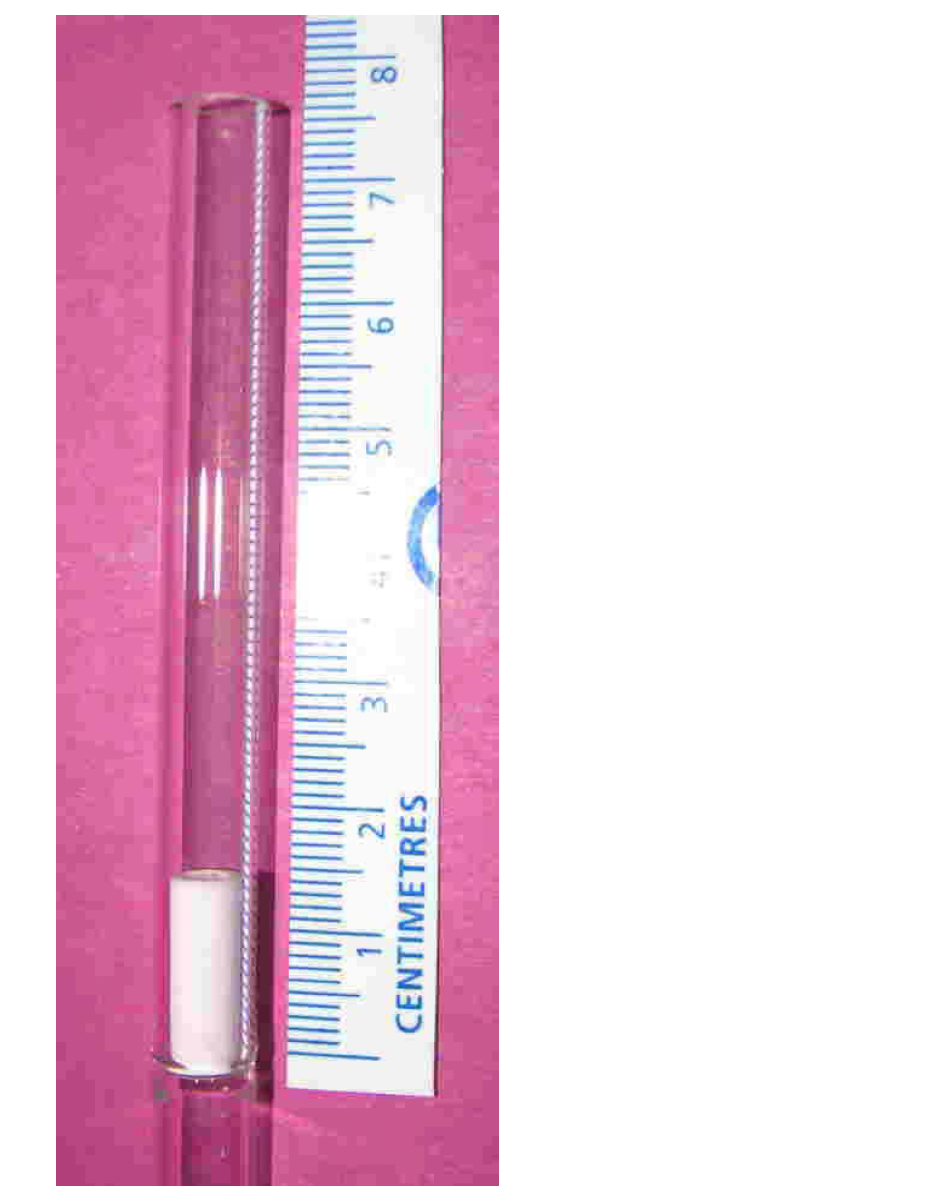
For normal, small sample, measurements, MPN has used GE-214 Fused Quartz tubing ( amorphous silica glass) as a sample holder material in high temperature dielectric property measurements since 1998. The normal sample holder used at MPN (in a vertical orientation) is a GE-214 tube, 6 mm OD, 4 mm ID, 438 mm long, with a thin ( ~ 1 mm thick ) fused silica base ( formed by our glass-blower using the actual tube material) placed ~ 76 mm down from the top end of the holder. The normal test sample ( ~ 12 mm long (or high)) sits inside the holder, supported on this base.
Description of Normal Cavity Perturbation Measurement Technique:
The measurement is done using a very thick-walled, water-cooled copper cavity of ~ 54 mm inside height and ~ 60 cm inside diameter, with small holes top and bottom at the centre through which the holder moves vertically ( see photo below, and see the sketches on the MPN website – MicrowavePropertiesNorth.ca ). The cavity has six resonant frequency modes between 400 MHz and 2986 MHz. A furnace is mounted directly above the cavity, and a small hole in the furnace bottom allows the sample holder ( with sample) to be inserted up through the cavity and into the furnace, leaving a long cool portion of the holder still below the cavity which can be gripped for holding and moving the holder.
A measurement is accomplished by inserting the holder plus sample up into the hot furnace, and then, after a suitable soak time, rapidly pulling the holder with the sample down into the cavity for measurement. The actual transport of the sample down into the cavity and subsequent measurement sweep of the cavity with an HP 8753B Network Analyzer ( all computer synchronized) takes ~ 2 seconds per frequency, so very little cooling occurs during the measurement. After measurement of two frequencies, for example, the sample is rapidly returned to the furnace, for a total lapsed time out of the furnace of ~ 4.5 seconds.
An important step in the measurement sequence allows us to measure the small, but inevitable, thermal drift of the cavity during a high temperature measurement. Immediately before the a high temperature measurement is performed ( that is, after the soak time at the specific requested temperature), the frequency and Q of the cavity are measured with the lower cool part of the holder in the cavity ( the position that places the sample-containing part of the holder up in the furnace at the correct heating location). In this way, the frequency drift of the cavity is accurately measured during the thermal cycling of the sample, and accurate corrections of both cavity frequency and Q are done.
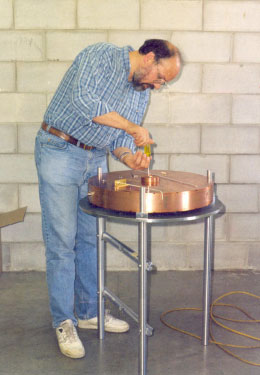
TMono Cavity During Initial Manufacture and Probe Installation
Methodology of Present Experiment:
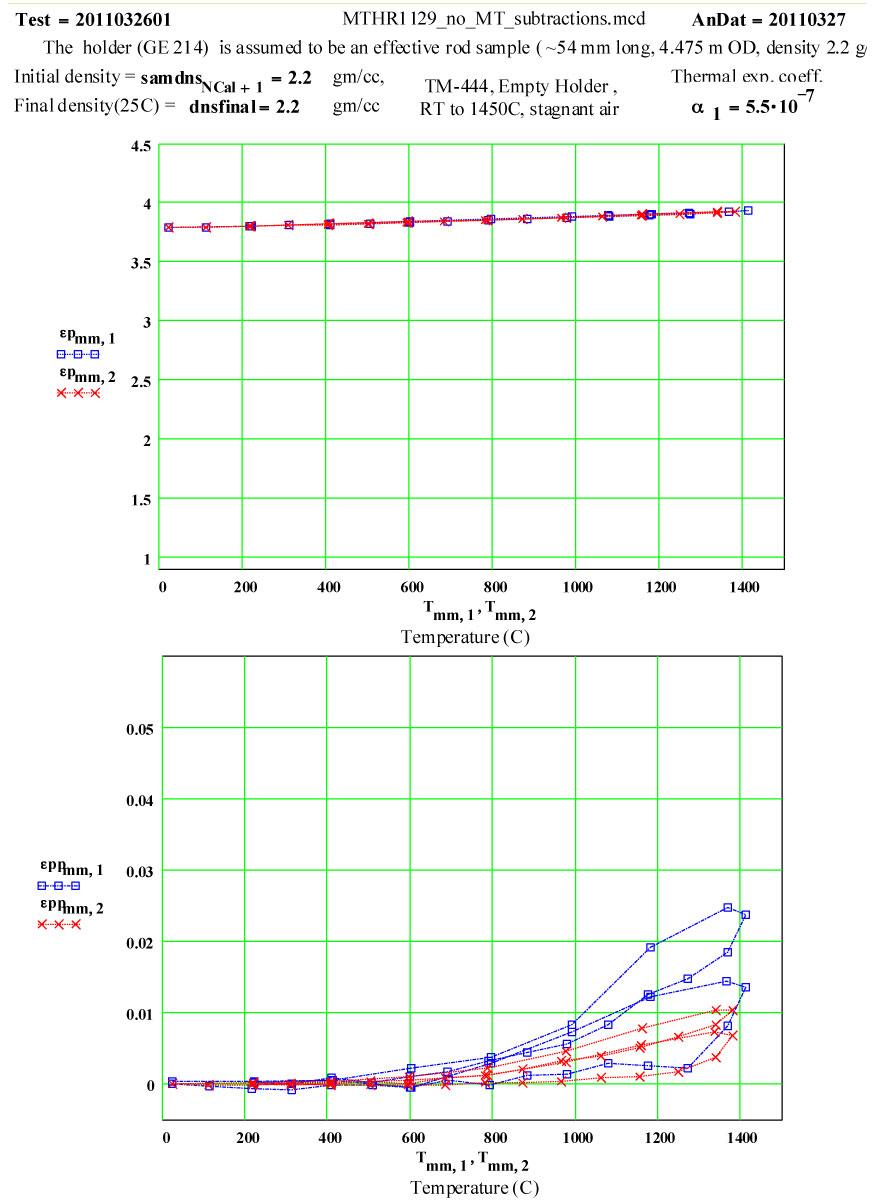
An approximate measurement of the properties of GE-214 was done by assuming the empty sample holder, itself, was the “sample”, ~ 54 mm long ( this is the length of the portion of the holder spanning the cavity top-to-bottom). This is an approximation, as the slight deformation of electric fields around the entrance hole changes the effective length slightly. In the present case, the volume of the tube material actually in the cavity fields was estimated to within ± 4% . The MPN TM0n0 cavity has been used for years for “cavity perturbation technique” measurements, and thus the absolute calibration factors are known to within errors of ± 5%.
The room temperature value of the dielectric constant of fused quartz ( density 2.20 g/cc) has been well measured by a few authors, and it is generally accepted that at 25ºC the value of ε′ is between 3.75 and 3.85, while the dielectric loss constant, ε′′ is ≤ 5 * 10-4 .
Details of Dielectric Properties Measurement Run Using, as a Sample, an Empty Solid-base GE-214 Sample Holder, TM-444 :
This holder was clean and not previously used at high temperature. It was essentially “as delivered” from M. Toonen at the Univ. of Calgary, our glass-blower.
The initial sample holder tube parameters, as related to this measurement were:
a) outside diameter 6.00 ± 0.05 mm
b) inside diameter 4.00 ± 0.05 mm
c) length 54.5 +- 2.5 mm
d) mass 1.885 gm
e) room temperature density assumed to be 2.20 gm/cc.
f) appearance - clear glass
The dielectric properties measurements were performed at RT, 50°C and then 50ºC steps to 1400°C, 1450ºC, then 1400ºC, then in -100C steps back down to 200ºC. The complete cycle was then repeated.
A second run of two cycles was done a few days later on the same holder. The data for both of these runs are presented, giving an accumulated 4 cycles to 1450ºC on the material.
The cavity perturbation data analysis formulae used by MPN assume a rod-shaped sample. Thus, for data analysis, an equivalent diameter was assumed, which had the same volume and same length as the actual tube.
The “equivalent” room temperature rod sample properties, used in the data analysis were :
a) diameter 4.475 ± 0.05 mm ,
b) length 54.5 mm
c) mass 1.885 gm
d) room temperature density 2.20 gm/cc.
Legend for Data Plots :
# Frequency(MHz) Symbol
1 912 blue square, solid line
2 2466 red cross, dotted line
3 Furnace Temperature solid black line
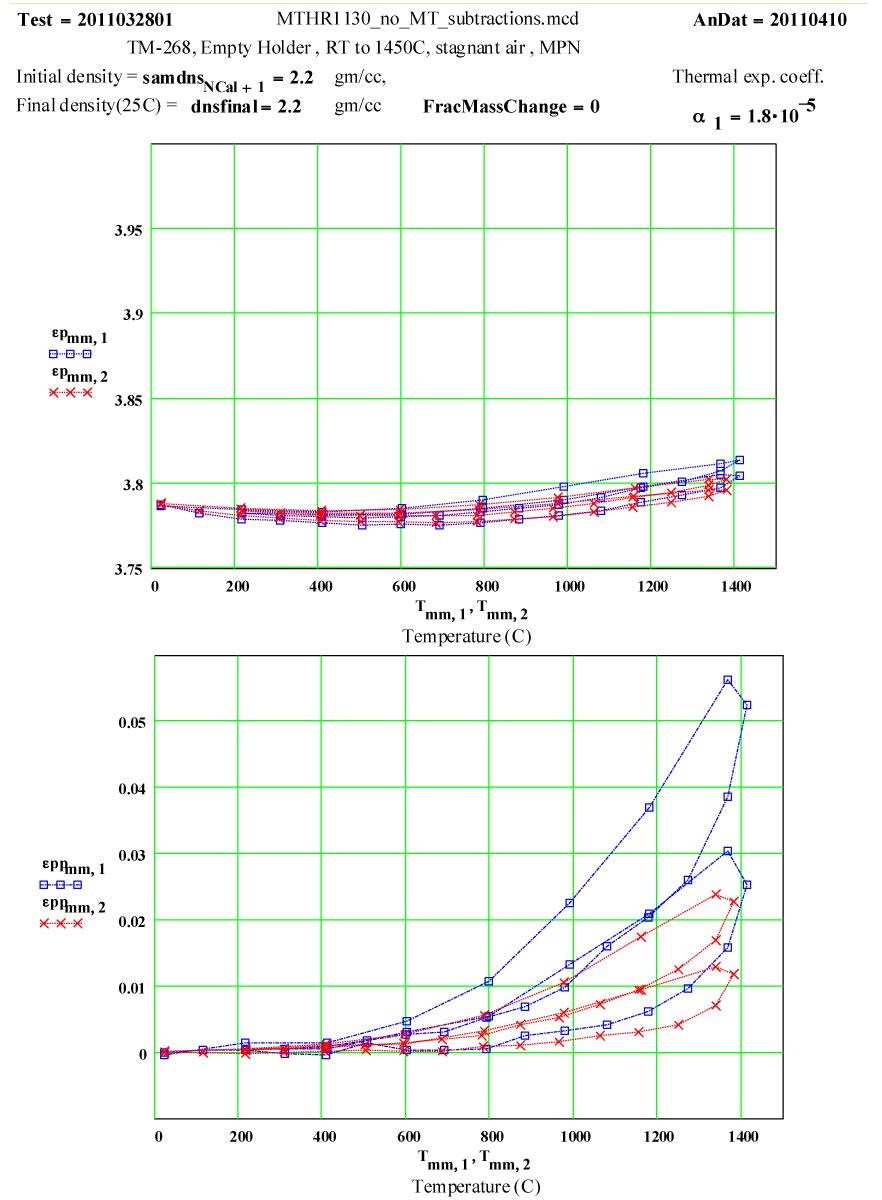
Note that the plot name for ε′ is εp , while the plot name for ε′′ is εpp .
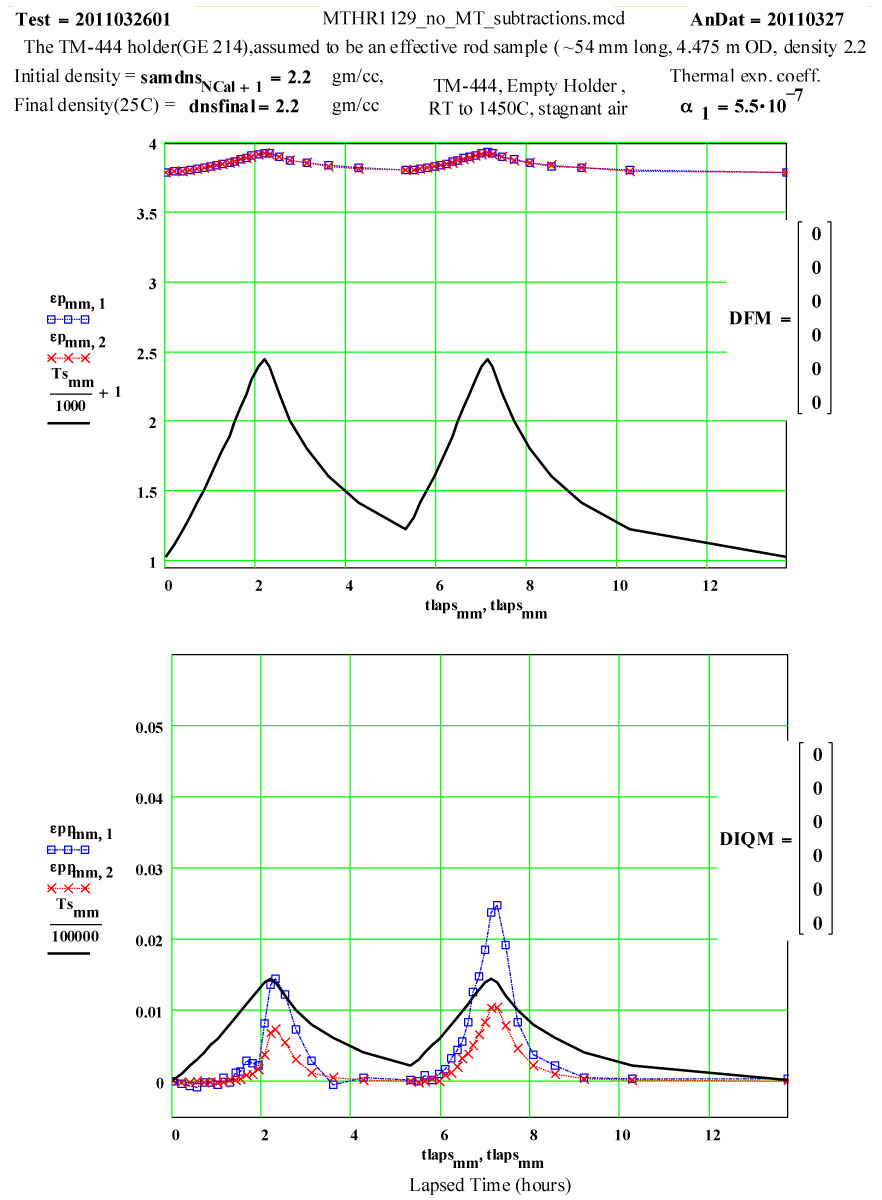
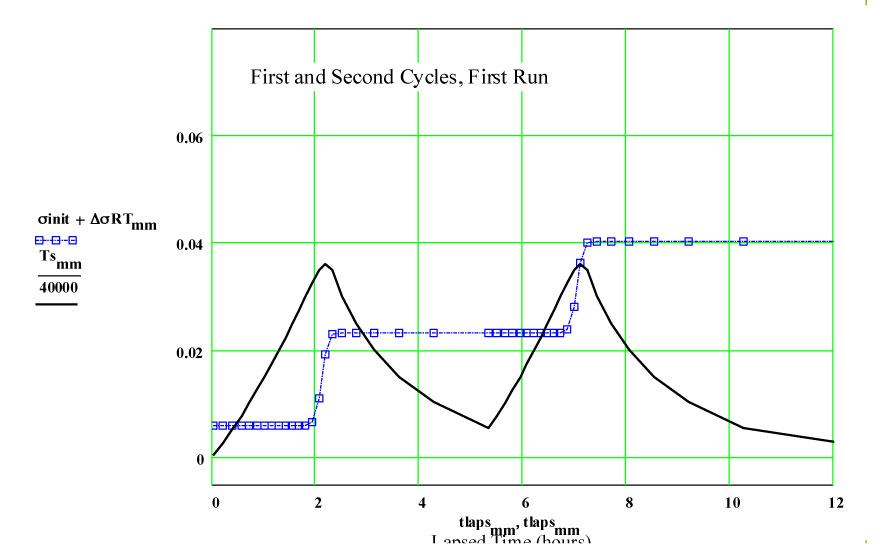
Plot of dielectric constant values during the first and second cycles of Fused Quartz sample holder TM-444 up to 1450ºC.
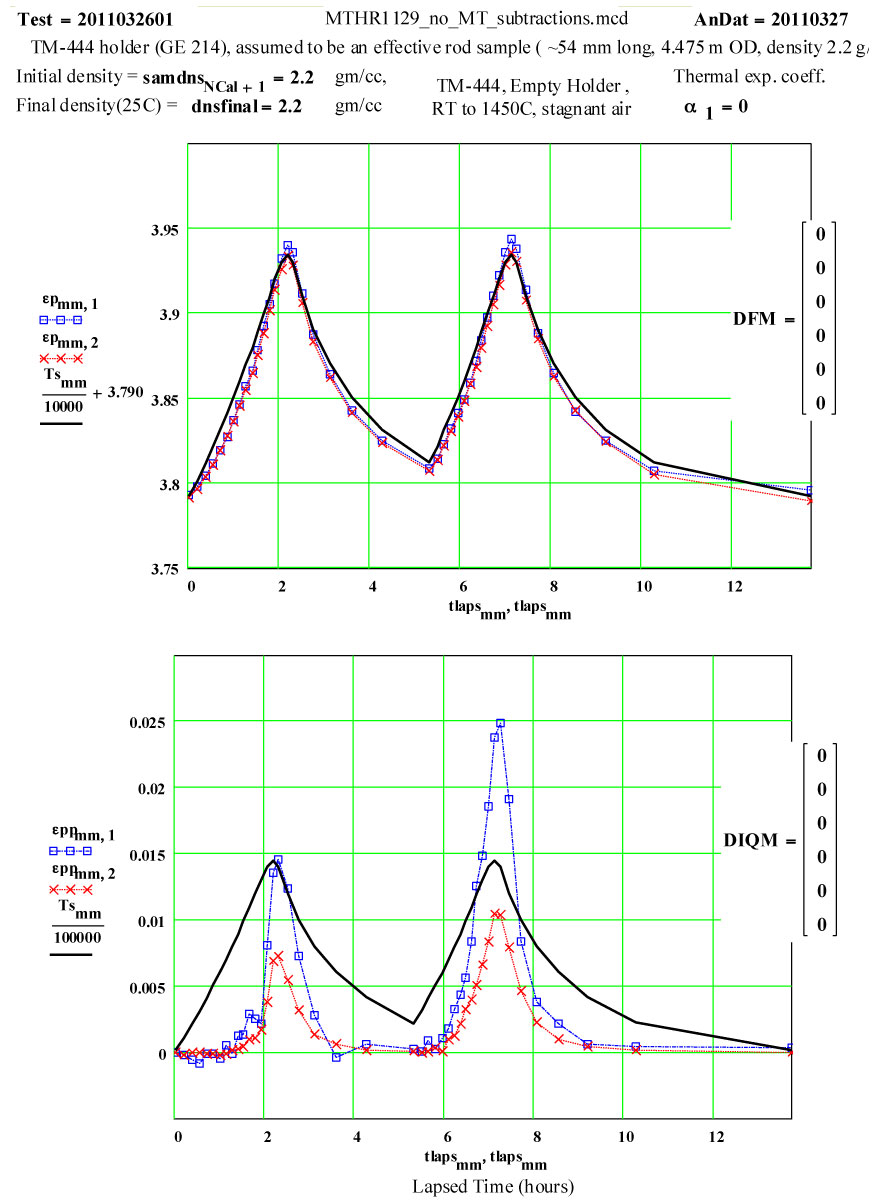
Plot of dielectric constant values during the first and second cycles of Fused Quartz sample holder TM-444 up to 1450ºC. Note that the value of ε′ increases by 0.15 between room temperature and 1450ºC, and is reversible .
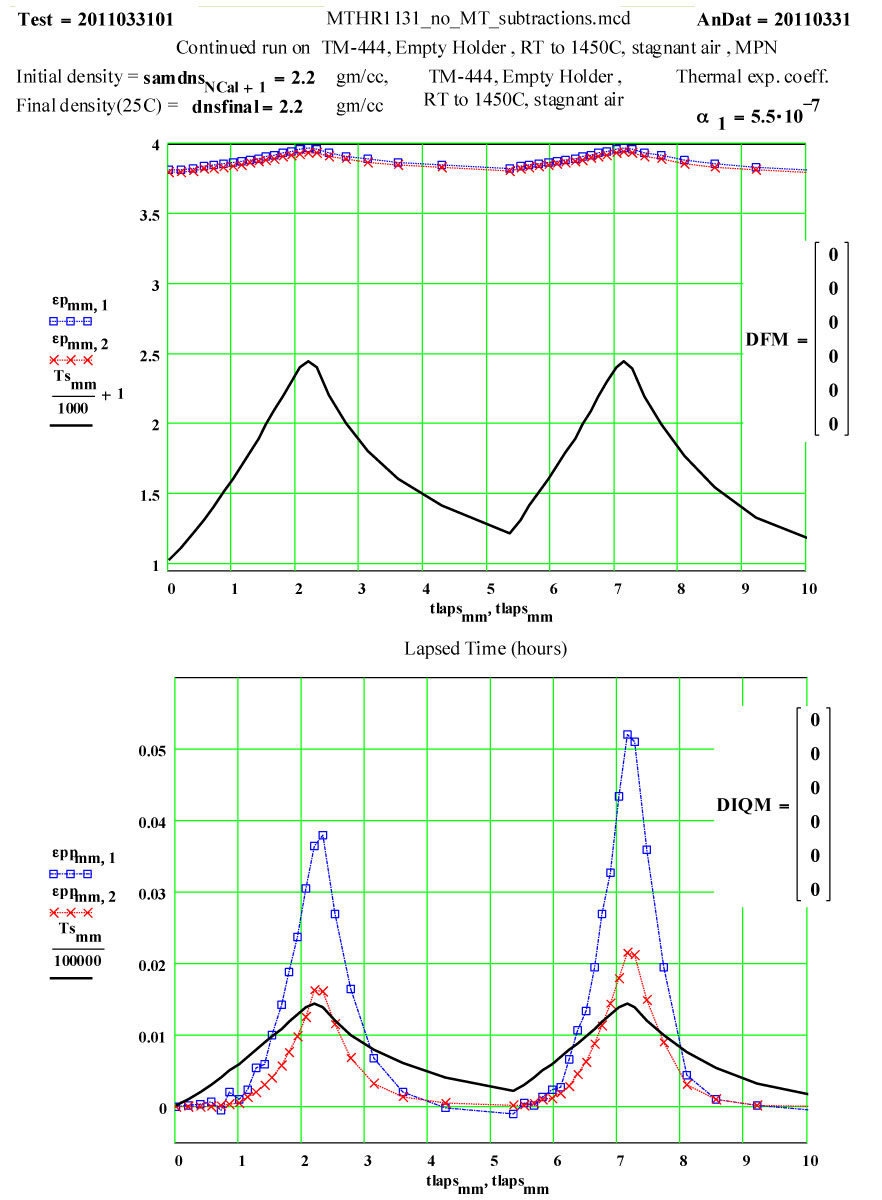
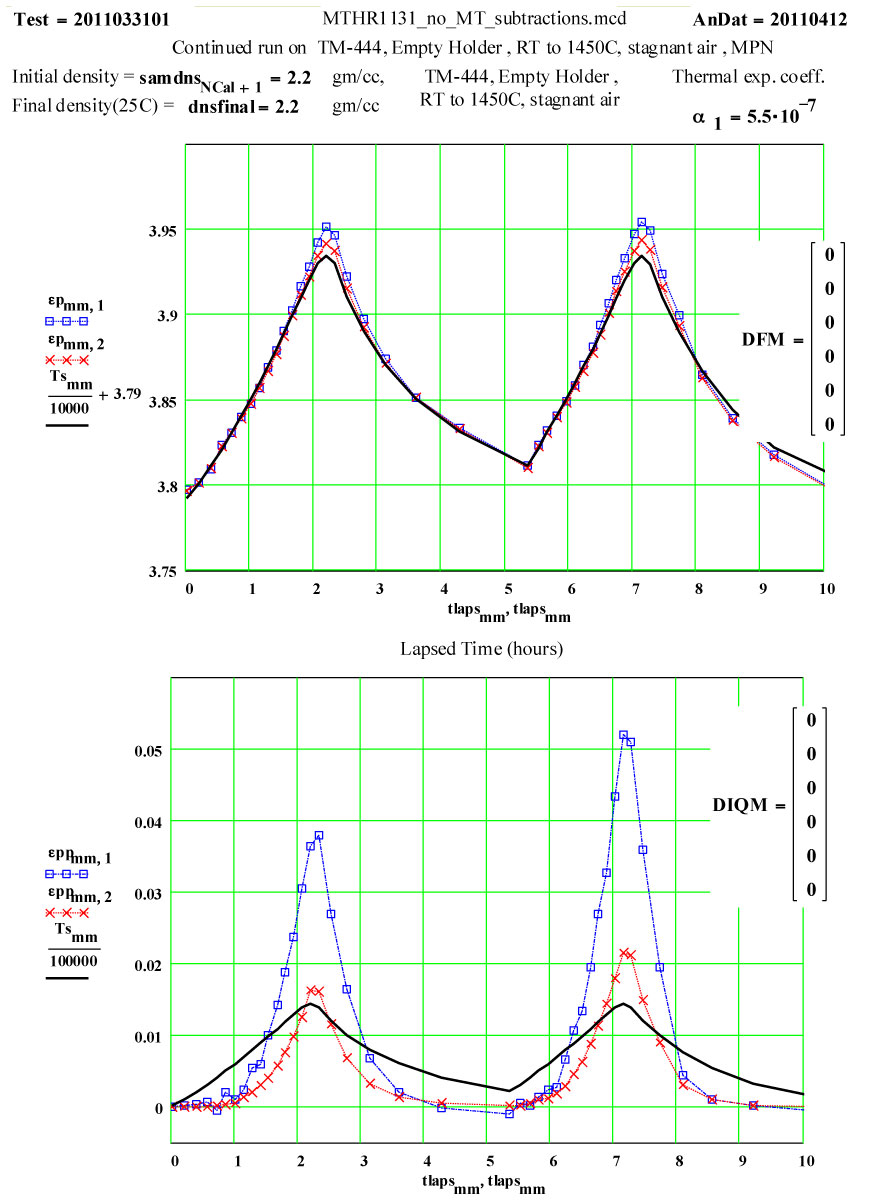
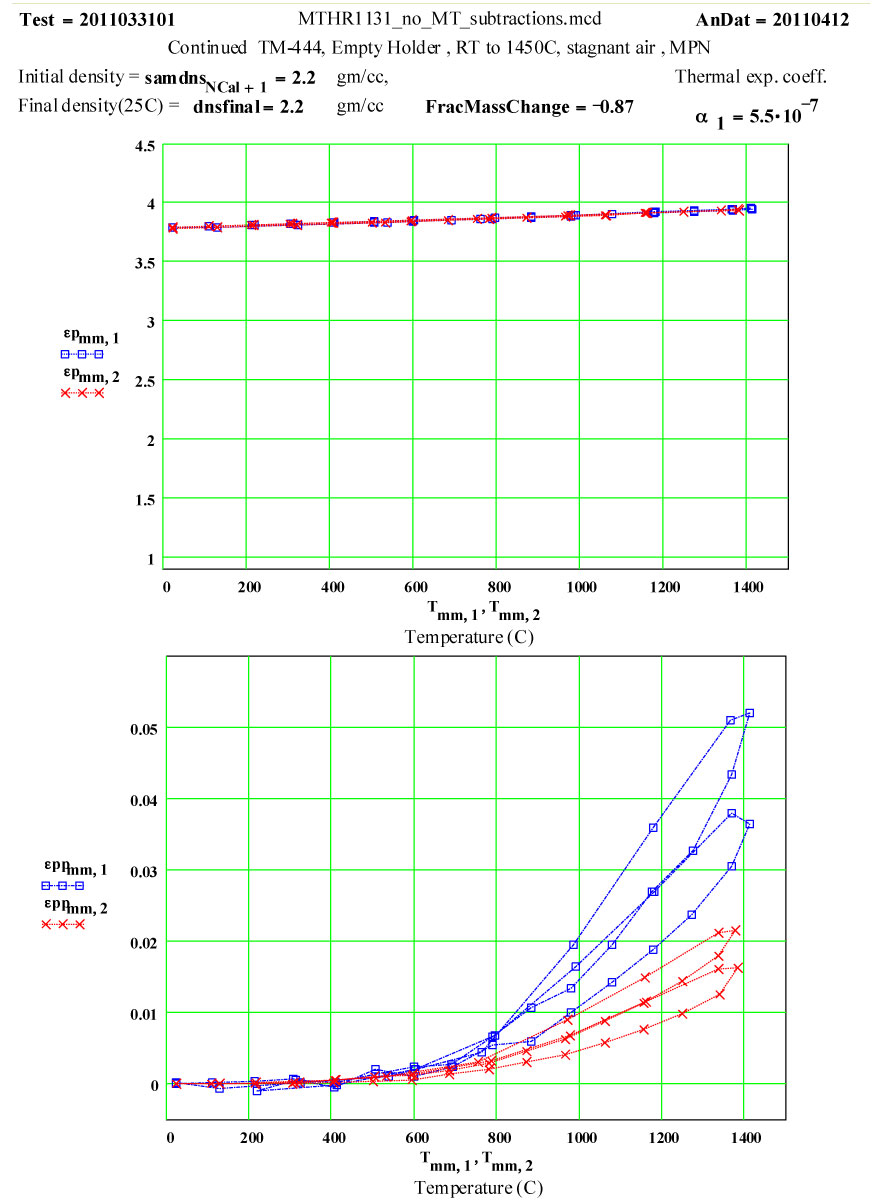
These plots clearly show the following characteristics:
1) The maximum high-temperature value of ε′′ is increasing with each cycle
2) The values of ε′′ below 1200ºC on a cool-down part of a cycle are roughly the same as the subsequent warm-up values up to 1200ºC on the next cycle.
3) Above 1200ºC on the warm-up portion of a cycle, the values increase irreversibly, making the subsequent cool-down values larger than the warm-up values.
These observations suggest that a lossy material is being irreversibly generated in or on the surfaces of the sample holder when the temperature is above 1200ºC, and that the amount of this material increases with each cycle. It is possible it is also being generated at lower temperatures, but if so, its dielectric loss is low enough to be within our noise level.
Anecdotal information would suggest that the material being generated is β-cristobalite, one of the crystalline states of SiO2 with a density of 2.20 g/cc ( essentially identical to that of amorphous fused silica). Amorphous silica glass ( called lechatelierite when found naturally) is known to transform into crystalline β-cristobalite above 1000ºC, bypassing other possible crystalline phases.
We have fitted the dielectric loss constant, ε′′ , using a thermally activated conductivity formulation which is almost frequency independent ( as free electron conductivity must be).
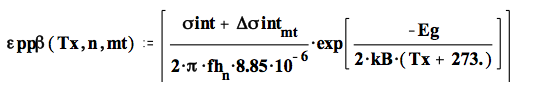
where fh is the frequency( MHz) , Eg the activation energy, kB is Boltzman`s constant, Tx is the temperature in degrees C , and the conductivities are the initial and incremental values in Siemens/m .
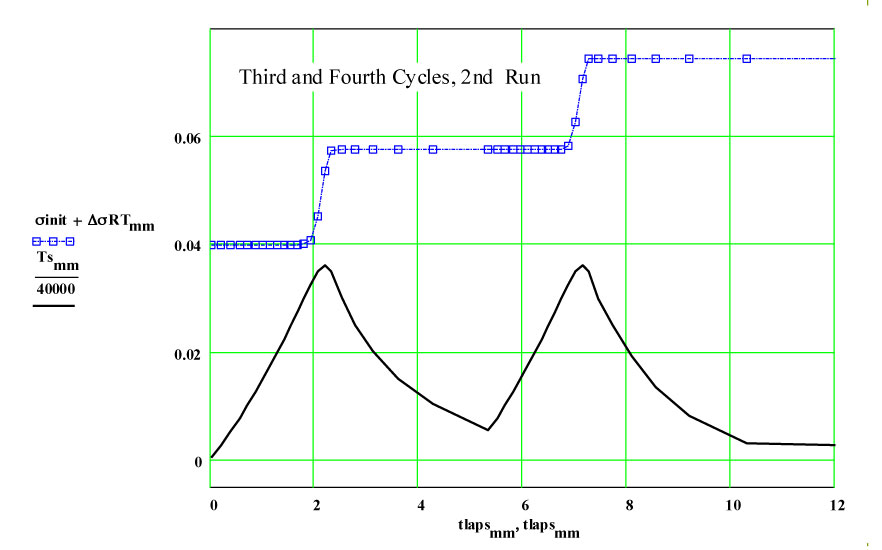
The following plots show the fit to the second cycle of the first run.
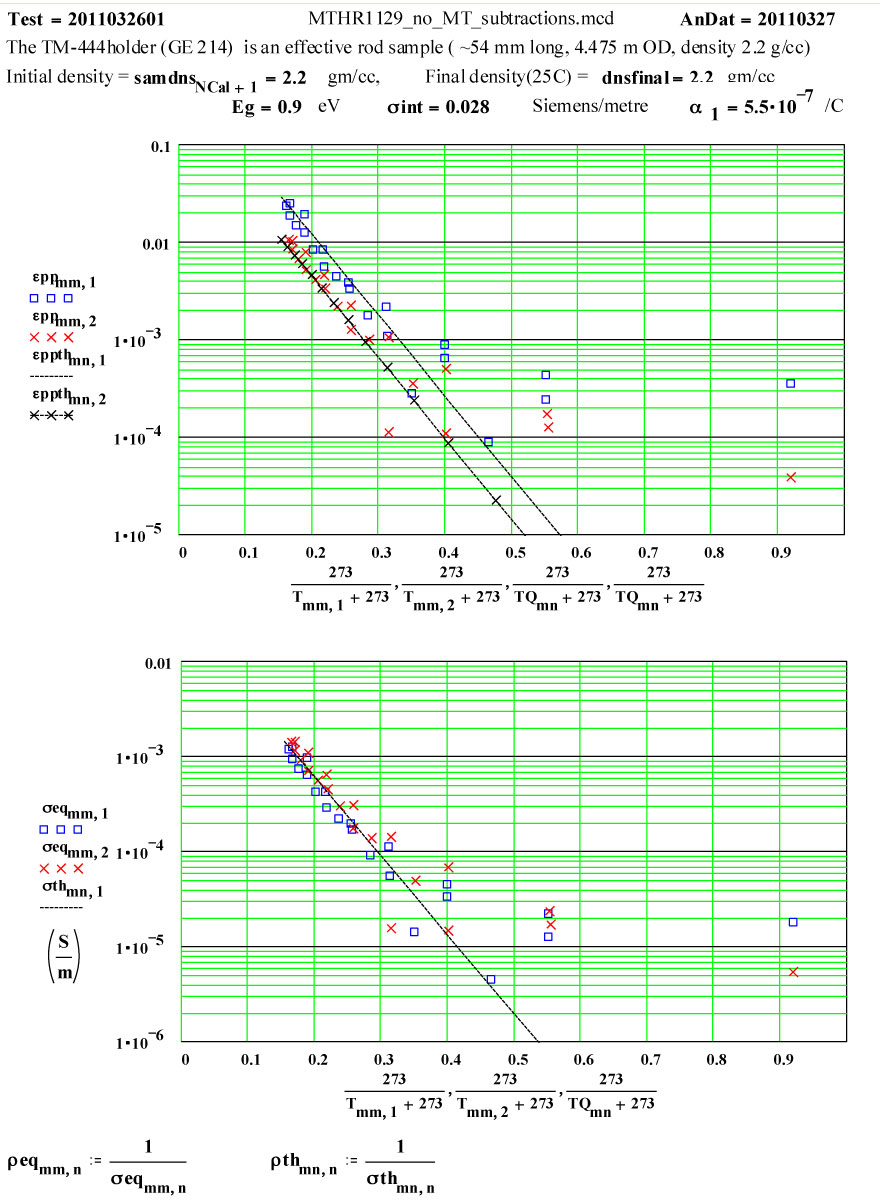
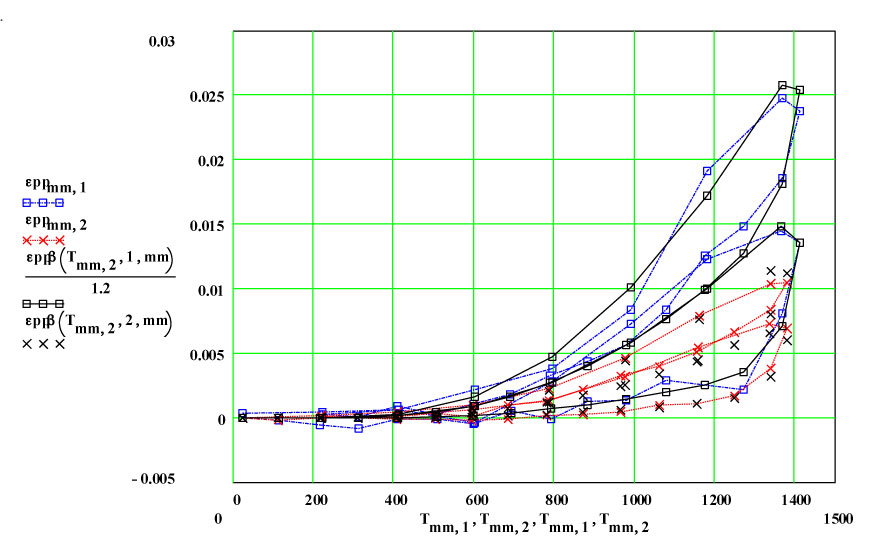
Two cycles of measured data ( coloured) and theoretical fits using thermally activated conductivity theory for calculating dielectric loss, with Eyring reaction theory formalism used to calculate the fractional production of the lossy species during the high temperature parts of each cycle.
Note again, that a new sample holder, TM-444, was used for this experiment, and it had not been previously cycled to high temperatures except by the glass-blower to insert the base. Thus the maximum possible value of ε′′ for the “almost virgin” GE-214 is given by the initial run up values. The random errors encountered in the measurement of such small values of ε′′ are obvious, and are approximately equal to ± 0.0006 and ± 0.0003, but a line drawn through the average values should be reliable and represent an upper limit for amorphous GE-214 Fused Silica.
The estimated numerical values of “fresh” GE-214 at 1200ºC are:
915 MHZ : ε′′ ≤ 0.0025 ± 0.00062450 MHZ : ε′′ ≤ 0.0015 ± 0.0003
The actual incremental values of the equivalent room temperature conductivity taken from the fits to the plots demonstrate that the amount of new material produced by each cycle is relatively constant, and the transformation occurs only at high temperatures.
Details of Dielectric Properties Measurement Run Using, as a Sample, an Empty Flow-through-base GE-214 Sample Holder, TM-457 :
This holder was clean and not previously used at high temperature. It was essentially “as delivered” from M. Toonen at the Univ. of Calgary, our glass-blower.
The initial sample holder tube parameters, as related to this measurement were:
a) Outside diameter 6.00 ± 0.05 mm
b) Inside diameter 4.00 ± 0.05 mm
c) length 54.5 +- 2.5 mm
d) mass 1.885 gm
e) room temperature density assumed to be 2.20 gm/cc.
g) appearance - clear glass
The dielectric properties measurements were performed at RT, 50°C and then 50ºC steps to 1400°C, 1450ºC, then 1400ºC, then in -100C steps back down to 200ºC. The complete cycle was then repeated.
A second run of two cycles was done a few days later on the same holder. The data for both of these runs are presented, giving an accumulated 4 cycles to 1450ºC on the material.
The cavity perturbation data analysis formulae used by MPN assume a rod-shaped sample. Thus, for data analysis, an equivalent diameter was assumed, which had the same volume and same length as the actual tube.
The “equivalent” room temperature rod sample properties, used in the data analysis were :
a) diameter 4.475 ± 0.05 mm ,
b) length 54.5 mm
c) mass 1.885 gm
d) room temperature density 2.20 gm/cc.
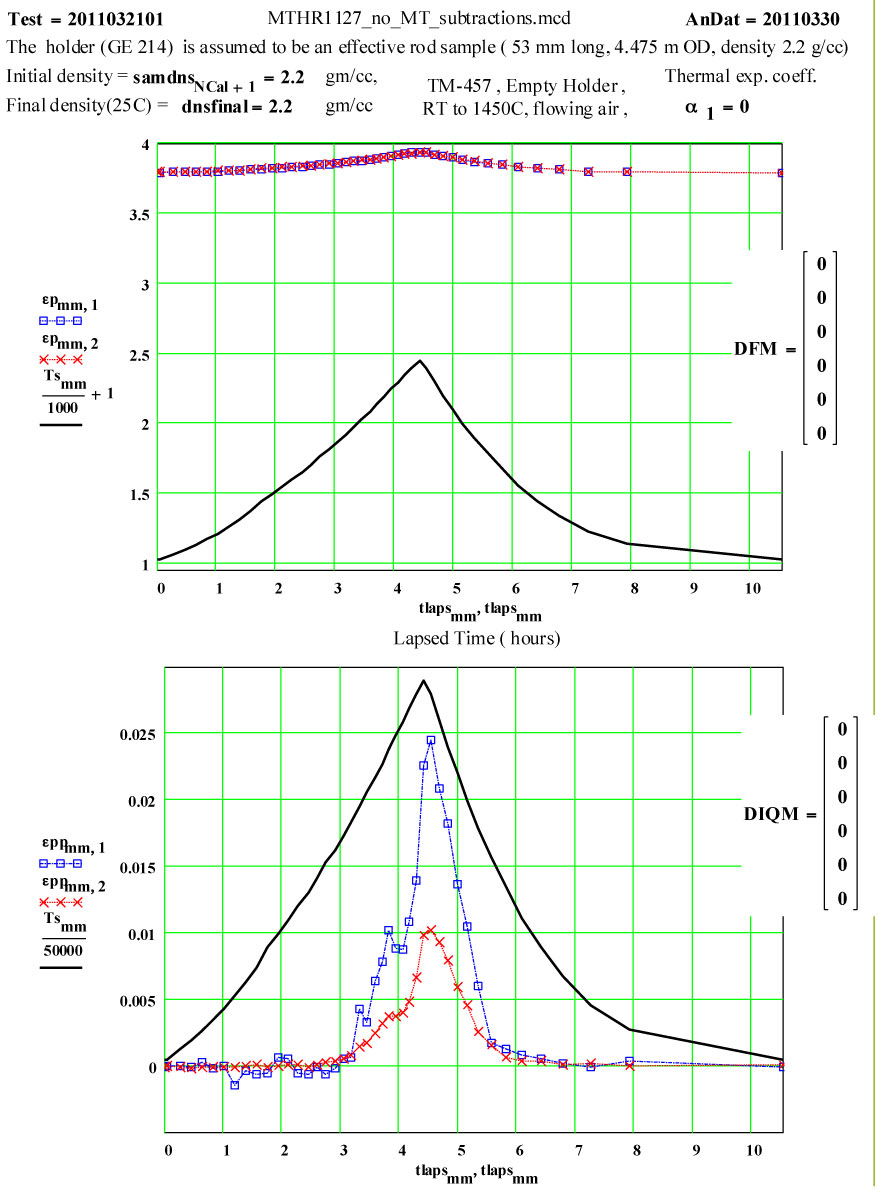
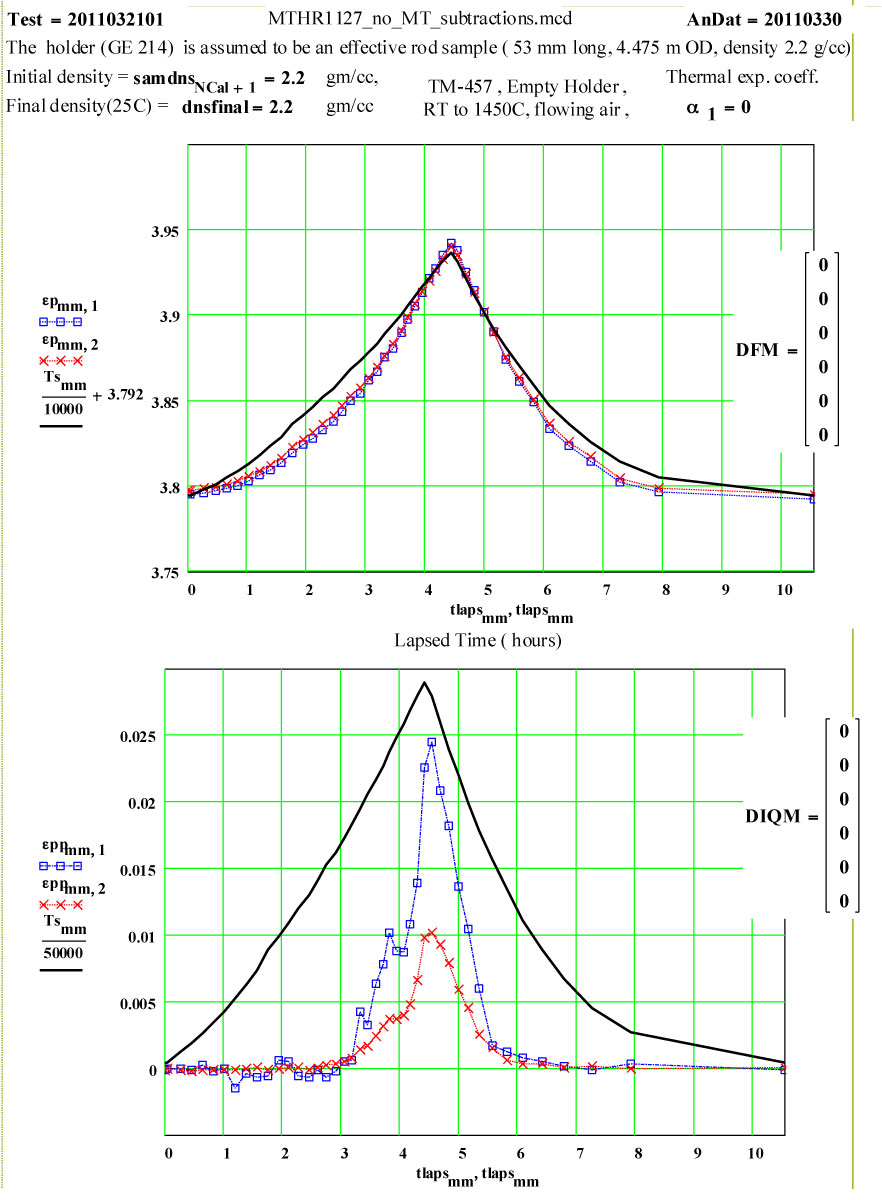
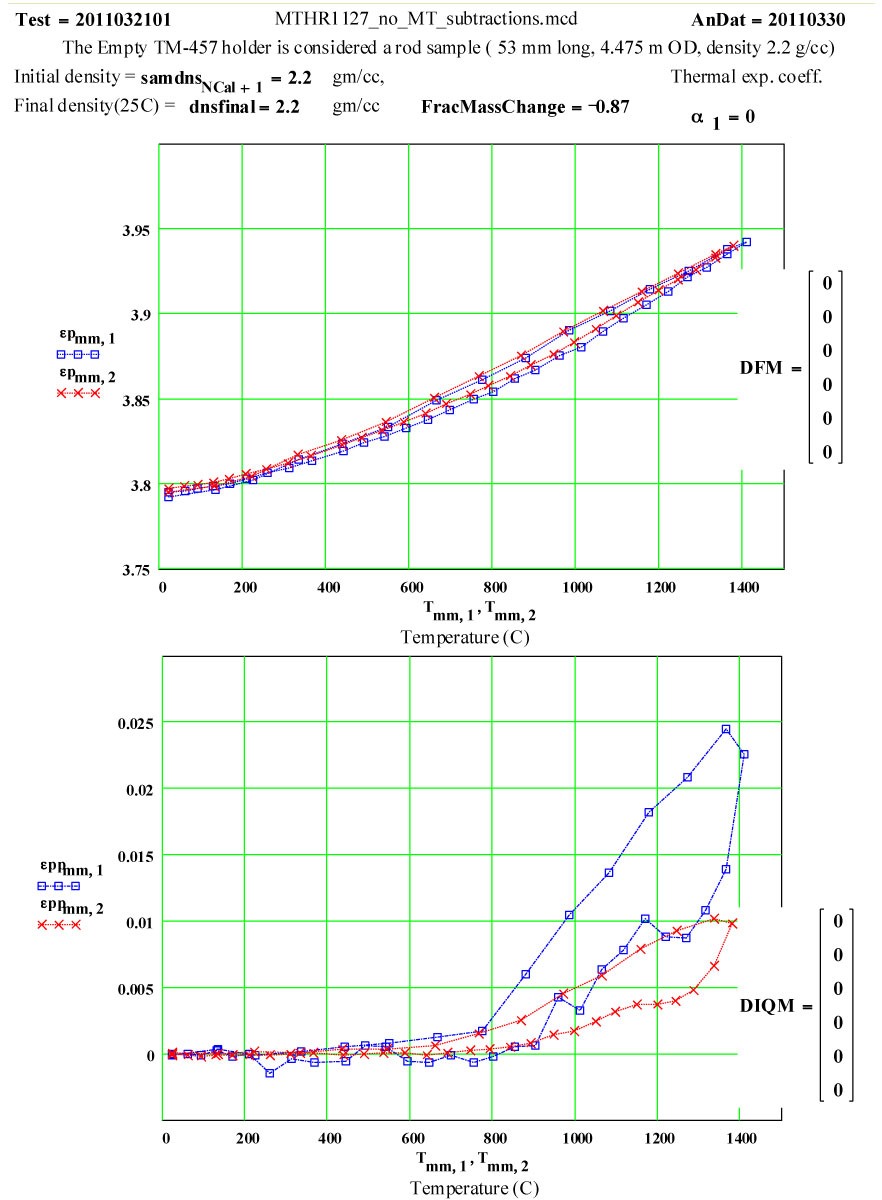
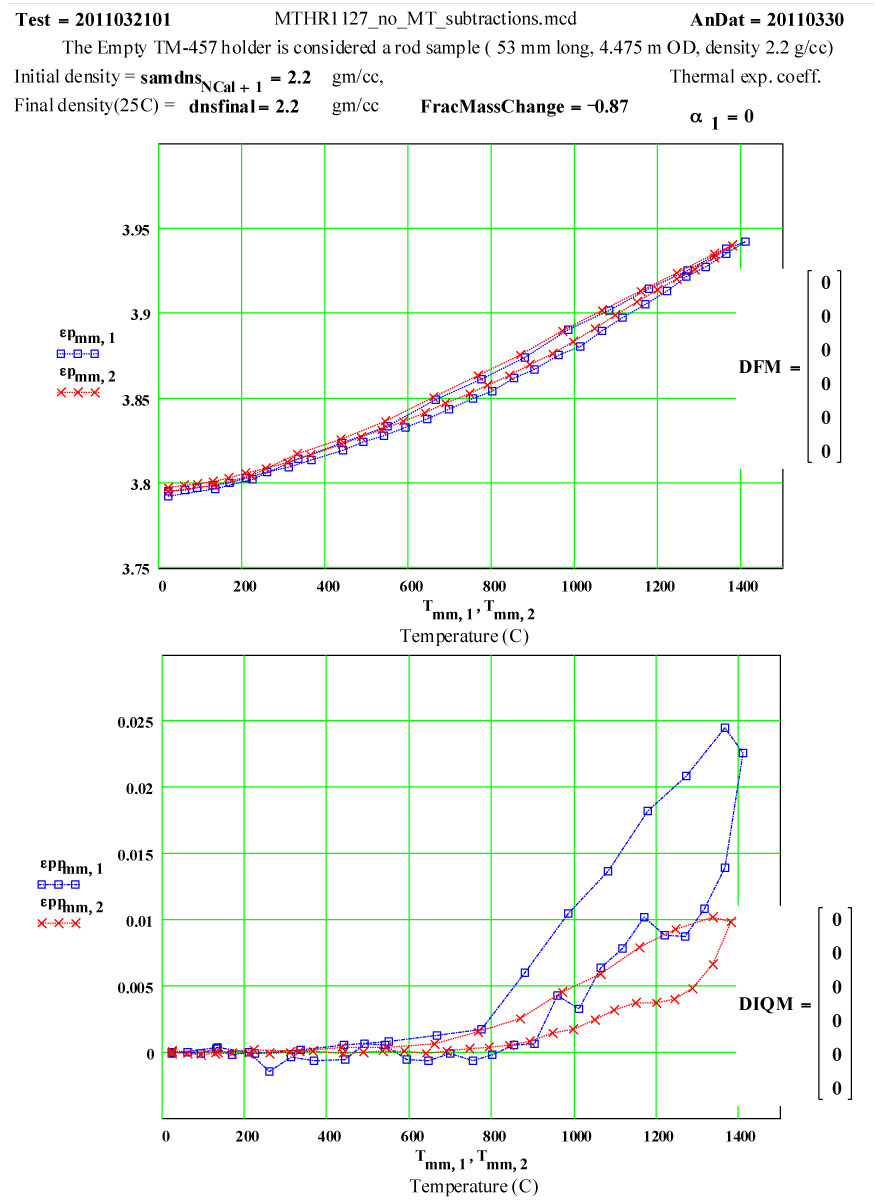
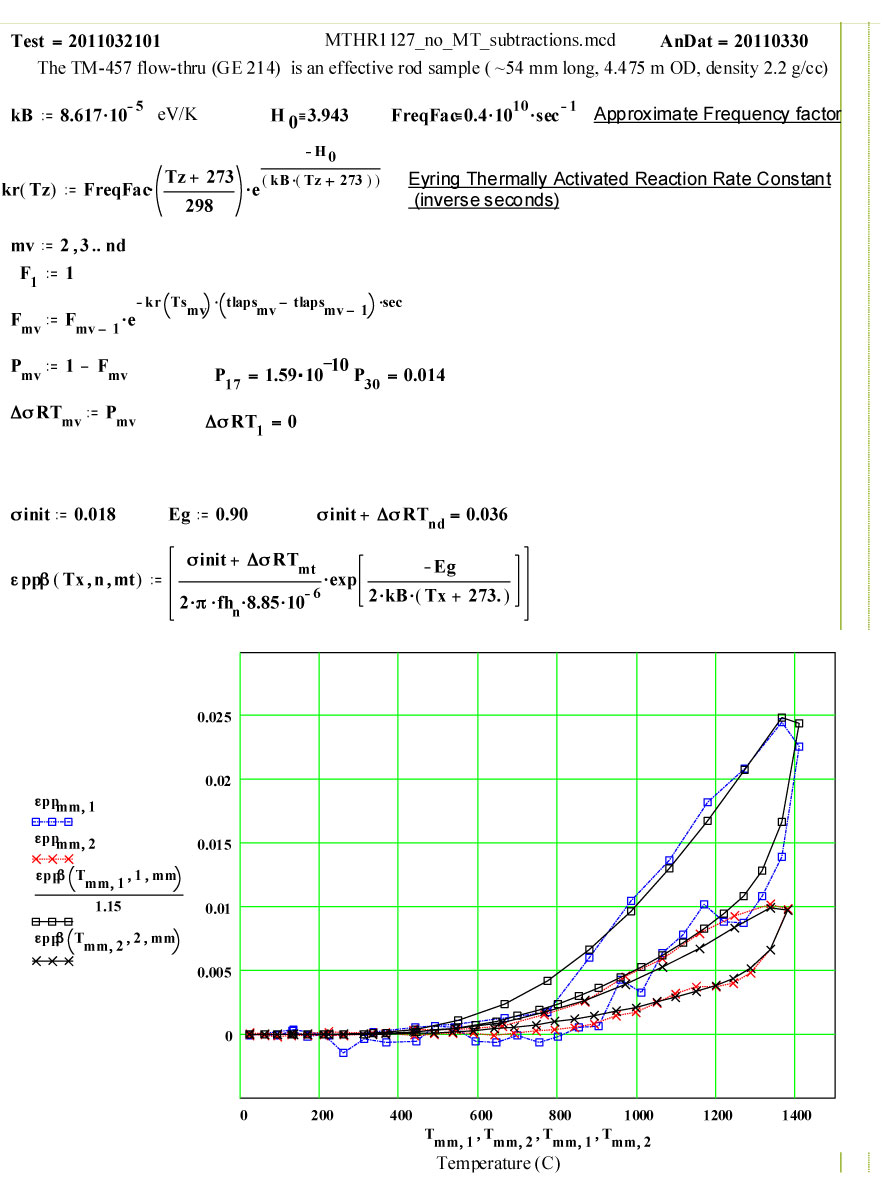
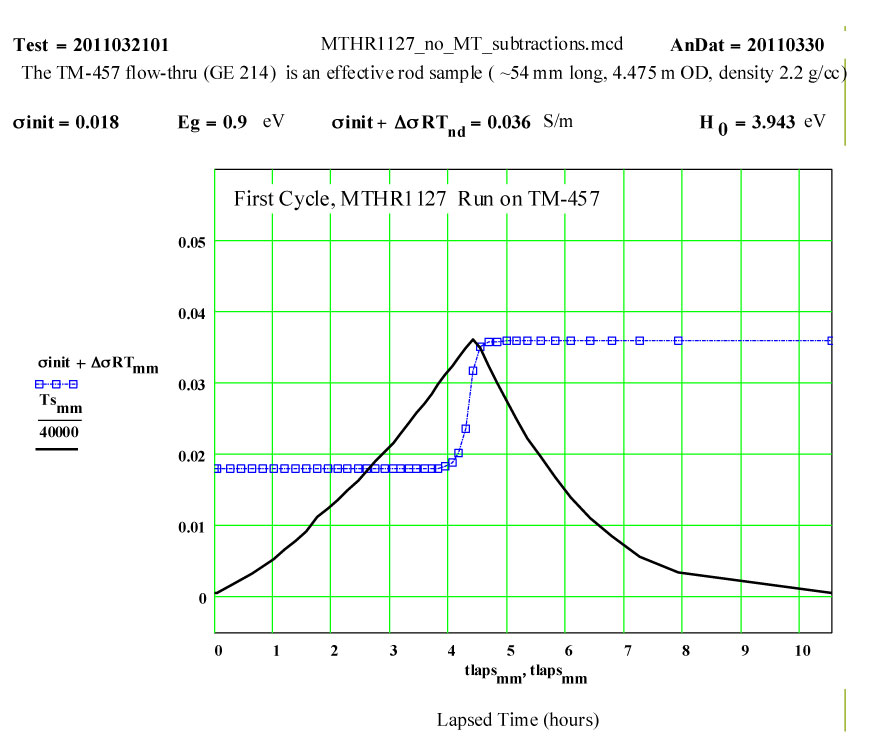
This plot shows the measured increase in the calculated “initial conductivity” ( see theory) required to fit the cycles of values of ε′′ to the Eyring thermally activated reaction rate theory for generation of a microwave absorbing species in the fused silica.
Details of Run on “Previously Used” Empty Solid-base GE-214 Sample Holder, TM-268, Analyzed Assuming Holder is Sample :
This holder had been previously used at high temperature. In late November, 2004, one empty run was done with it to 1450ºC ( to characterize the holder), and then a measurement run was done with it, on a cordierite sample, up to 1425ºC.
The initial sample holder tube parameters, as related to this measurement were:
a) Outside diameter 6.00 ± 0.05 mm
b) Inside diameter 4.00 ± 0.05 mm
c) length 54.5 +- 2.5 mm
d) mass 1.885 gm
e) room temperature density 2.20 gm/cc.
f) appearance - frosted glass
These “empty holder” measurements were performed at RT, 100°C and then 100ºC steps to 1400°C, 1450ºC, then 1400ºC, then in -100C steps back down to 200ºC. The complete cycle was then repeated, with a final measurement at room temperature.
The cavity perturbation data analysis formulae used by MPN assume a rod-shaped sample. Thus, for data analysis, an equivalent diameter was assumed, which had the same volume and same length as the actual tube.
The “equivalent” rod sample properties, at room temperature, were assumed to be:
a) diameter 4.475 ± 0.05 mm ,
b) length 54.5 mm
c) mas 1.885 gm
d) room temperature density assumed to be 2.20 gm/cc.
Legend for Data Plots :
# Frequency(MHz) Symbol
1 912 blue square, solid line
2 2466 red cross, dotted line
3 Furnace Temperature solid black line
Note that the plot name for ε′ is εp , while the plot name for ε′′ is εpp .
The data was analyzed assuming a value of zero for the average thermal expansion coefficient (CTE) up to 1450ºC.
The general apparent increase in ε′ with temperature can be eliminated by assuming an average fractional thermal expansion coefficient of the holder material of 1.8*10-5 /C .
This value seems very large for fused silica, whose CTE value up to 300ºC is accept to be ~ 0.55 * 10-6/C , and which is understood to be a very low thermal expansion coefficient material! ( See 3rd figure below).
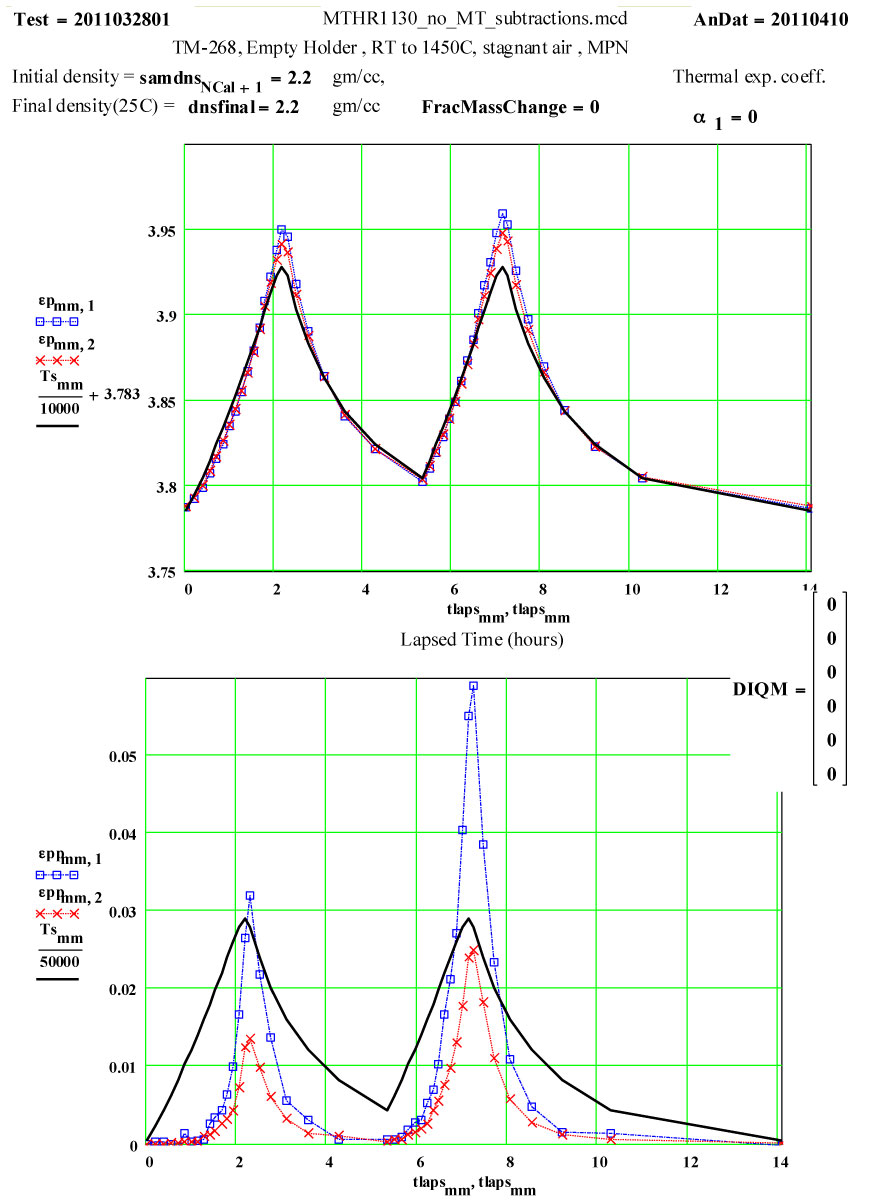
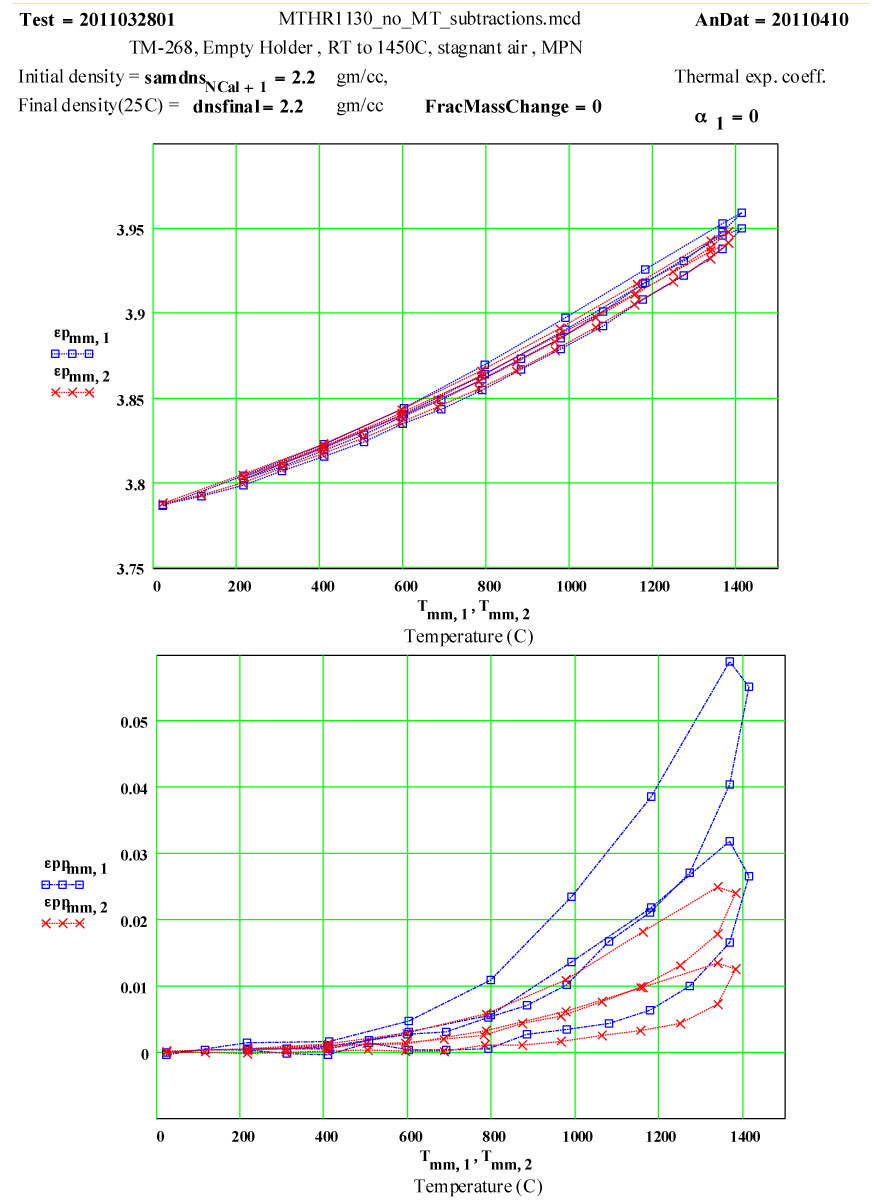
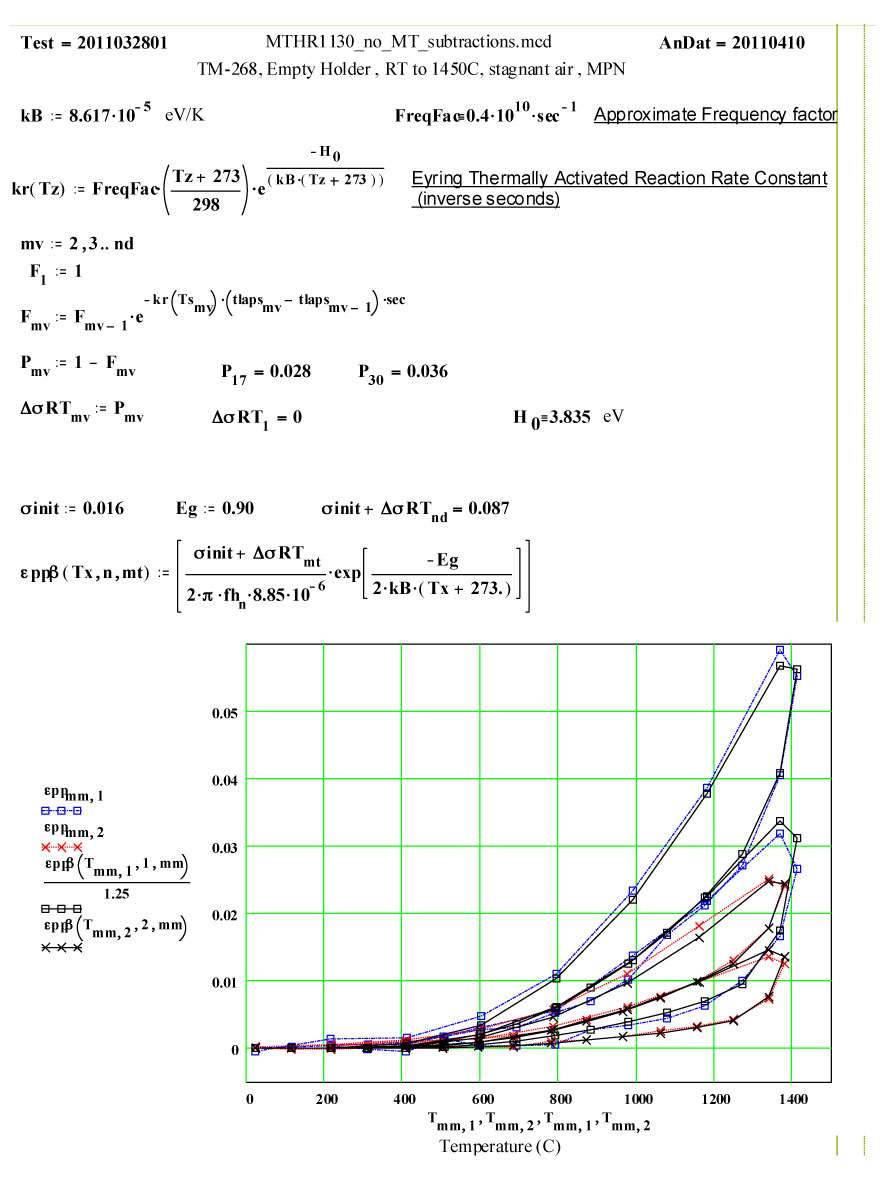
Two cycles of measured data ( coloured) and theoretical fits using thermally activated conductivity theory for calculating dielectric loss, with Eyring reaction theory formalism used to calculate the fractional production of the lossy species during the high temperature parts of each cycle.
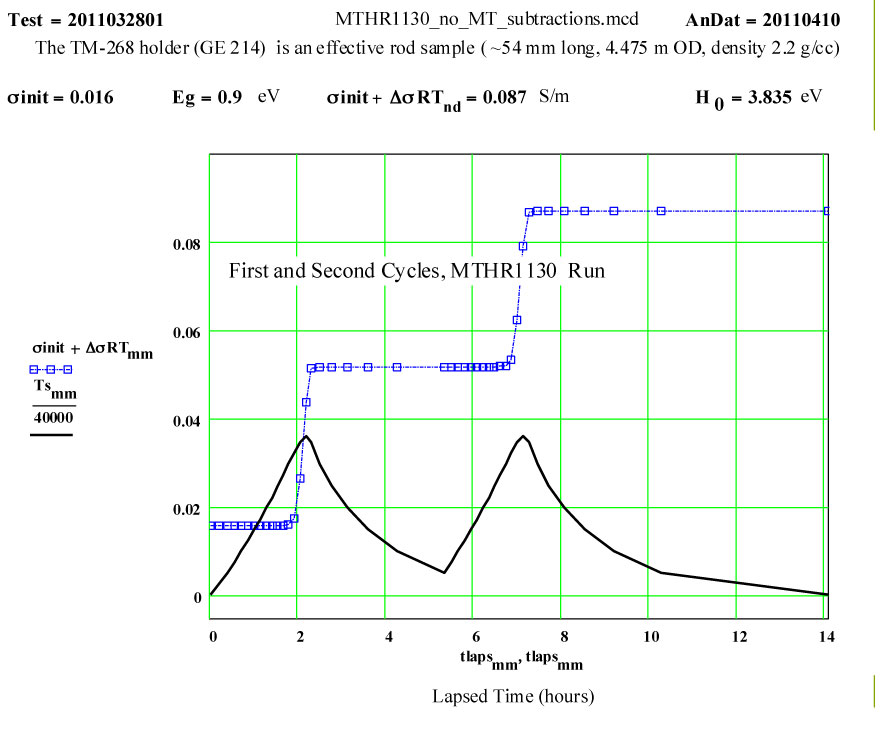
This plot shows the measured increase in the calculated “initial conductivity” ( see theory) required to fit the cycles of values of ε′′ to the Eyring thermally activated reaction rate theory for generation of a microwave absorbing species in the fused silica.
Please feel free to phone or e-mail and discuss possible measurements. We treat all communications as confidential unless advised otherwise.
Soda-Lime Silica Glass, Solid & Melt, to 1300ºC
Intent of Measurement:
This measurement demonstrates the ability of our new alumina
crucible technique to measure corrosive molten materials.
This is new data for a soda-lime silica glass (sample received
in 1993 from a Univ. of Florida student of Dave Clark),
was done with our new alumina crucible technique.
This data was collected during the first run on a high temperature molten material done in the new alumina crucible system developed at MPN, and represents early days of our system development. Thus the absolute errors will likely improve in future runs, and the data analysis techniques will improve.
The usual high purity amorphous silica sample holder used in the MPN system unfortunately is attacked rather rapidly by molten compounds which have freely migrating alkali ions in them. Thus previous attempts to measure in the melt regime have resulted in destroyed sample holders and very questionable data, due to interaction of the ions with the silica of the holder! High purity alumina is known to react much more slowly with active ions, so was considered as a possible substitute holder material. Since out technique requires long, very uniform tubes which can withstand large temperature gradients, no ceramic seemed practical as a replacement material.
However, placing a small crucible down, inside our usual holder, seemed a possible solution.
Suitable thin-walled crucibles of 99.7 % alumina were obtained ( Fig.1 ) and the usual MPN
room temperature calibration techniques using known calibration samples yielded results that
showed the usual perturbation analysis could be extended to samples inside such an alumina crucible.
Fortunately, the loss tangent for high purity alumina is relatively low compared with
most molten compounds, so the usual subtraction techniques for removing the influence of the
sample holder could be used without seriously decreasing the accuracy.
Sample Description:
The glass sample used for this measurement was a standard soda-lime silica float glass from PPG Industries, with the following composition:
| 73.05% | SiO2 |
| 13.75% | Na2O |
| 8.83% | CaO |
| 3.84% | MgO |
| 0.262% | SO3 |
| 0.12% | Al2O3 |
| 0.106% | Fe2O3 |
Strain Point : 504 C
Annealing Point: 544 C ( This is Tg, the glass transition temperature )
Softening Point : 723 C.
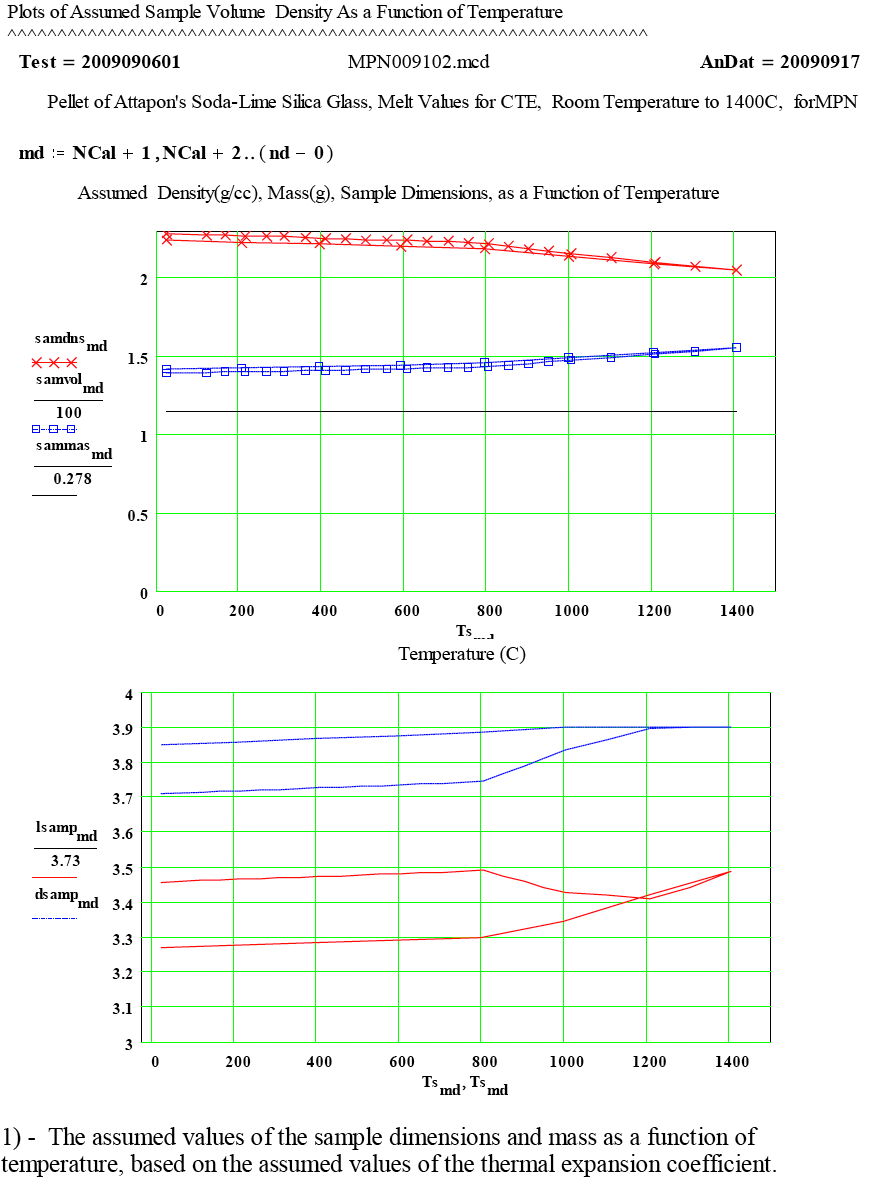
This data has been analyzed assuming a value for the CTE above the melt point calculated from the “Fluegel et al. “ paper “Density & CTE Calculations of Silicate Glass Melts from 1000ºC to 1400ºC” from the Eur. J. Glass Sci. & Tech. B, Oct. 2008, which gives fitted values of the CTE for the melt zone for a range of glasses.
For the following dielectric constant calculations, the value of the CTE has been assumed to be ~ 37 * 10-6 /C above 800ºC.
The sample was prepared by diamond core-drilling a piece of glass.
Initial Sample Properties:
| a) diameter | 3.68 +- 0.03 mm |
| b) length | 12.5 +- 0.10 mm |
| c) mass | 0.319 gm |
| d) room temperature density | 2.29 ± 0.15 gm/cc. |
| e) appearance | ground clear glass rod |
Measurement Cycle Parameters:
The dielectric properties data was collected by ramping the temperature in steps,
using a 6 minute hold at each step for the temperature to become uniform,
then measuring and then continuing on to the next temperature.
Measurements were done at room temperature, and then in 50°steps 1000°C,
then 100°C steps up to 1400°C, then -200°C steps down to room temperature.
Final Sample Properties:
| a) diameter | 3.85 +- 0.05 mm |
| b) length | 10.9 +- 0.3 mm ( mean length averaging meniscus) |
| c) mass | 0.319 gm |
| d) room temperature density | 2.25 ±0.20 gm/cc. |
| e) appearance | clear glass with large meniscus ( see photo of cross-section) |
Comments on the Data:
Our dielectric perturbation data analysis equations assume that the
electric fields in the sample are uniform over the sample volume.
If the data analysis yields values of ep and epp that give a value of the
Half-Power Depth that is less than the sample diameter, then the field in
the centre of the sample must be less than at the surface! Thus our determined
values of ep and epp should be regarded only as “indicators” when the
Half-Power Depth is less than the sample diameter – in this case 4 millimeters.
This commonly occurs when the values of ep and epp are over 100, in which case
the perturbation equations inherently have very large errors anyway, and should
be regarded as indicating only that the values are large!
| An 8 mm OD high purity GE-214 amorphous silica sample holder, with the 5.5 mm OD, ~ 0.75 mm thin-walled high purity alumina ( 99.7%) crucible inserted down to the base. |
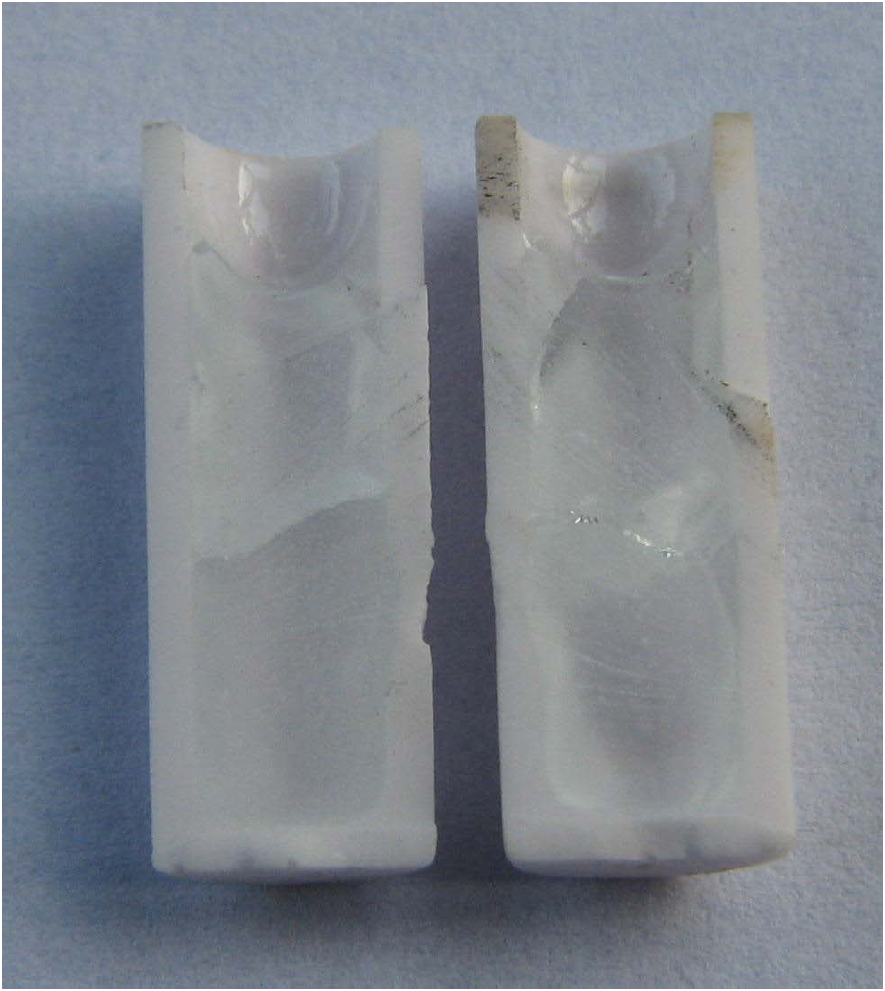
| A cross-section of the alumina crucible with the glass sample in it, after the data run to 1400ºC. Note the apparent large meniscus – which may be due to the large thermal expansion in the melt phase. |
The frequency coding on the plots is :
Legend for Data Plots :
| # | Frequency(MHz) | Symbol |
| 1 | 912 | blue square |
| 2 | 2466 | red cross |
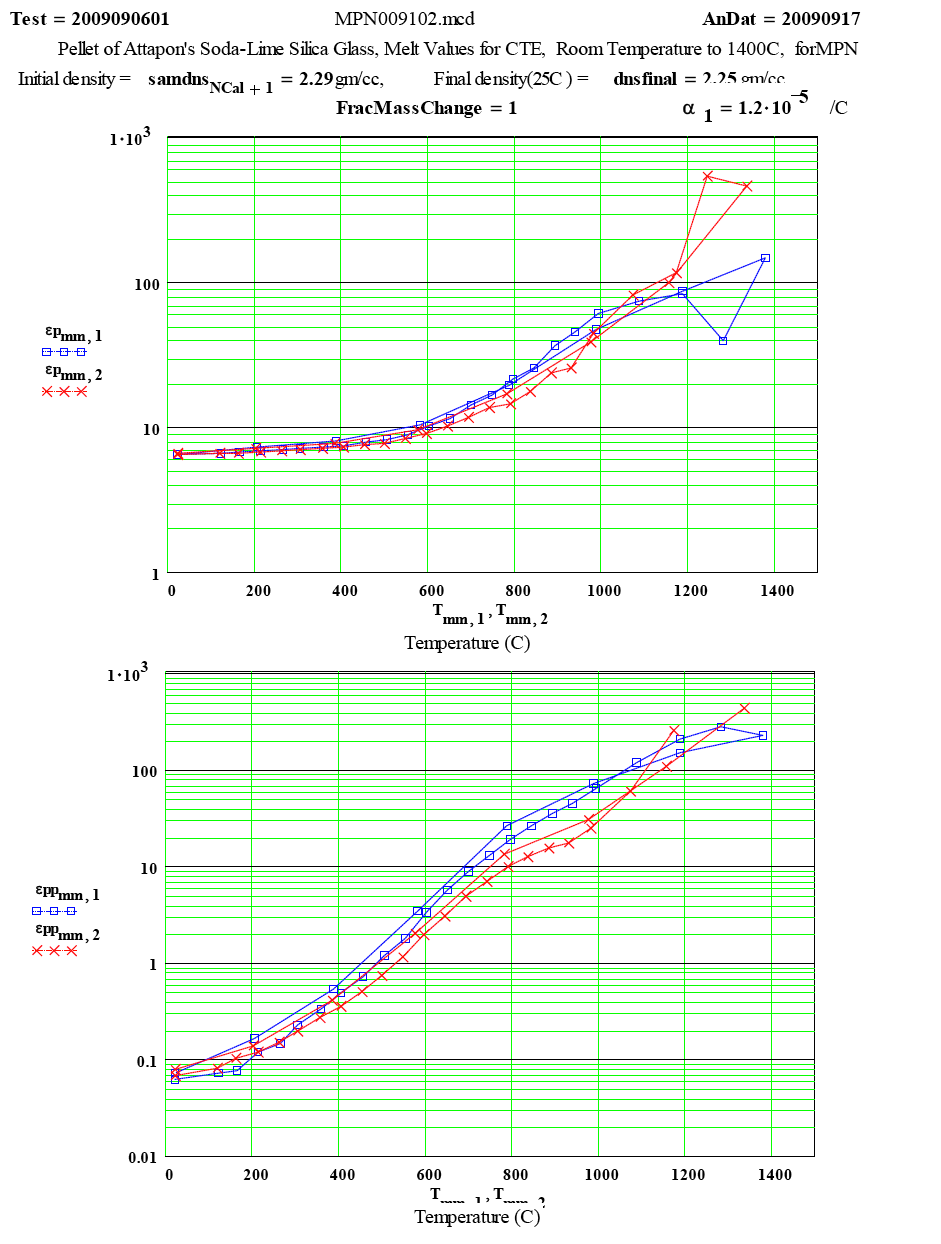
| The measured values of ε´ and ε´´ ( displayed as ep and epp ) as a function of temperature. |
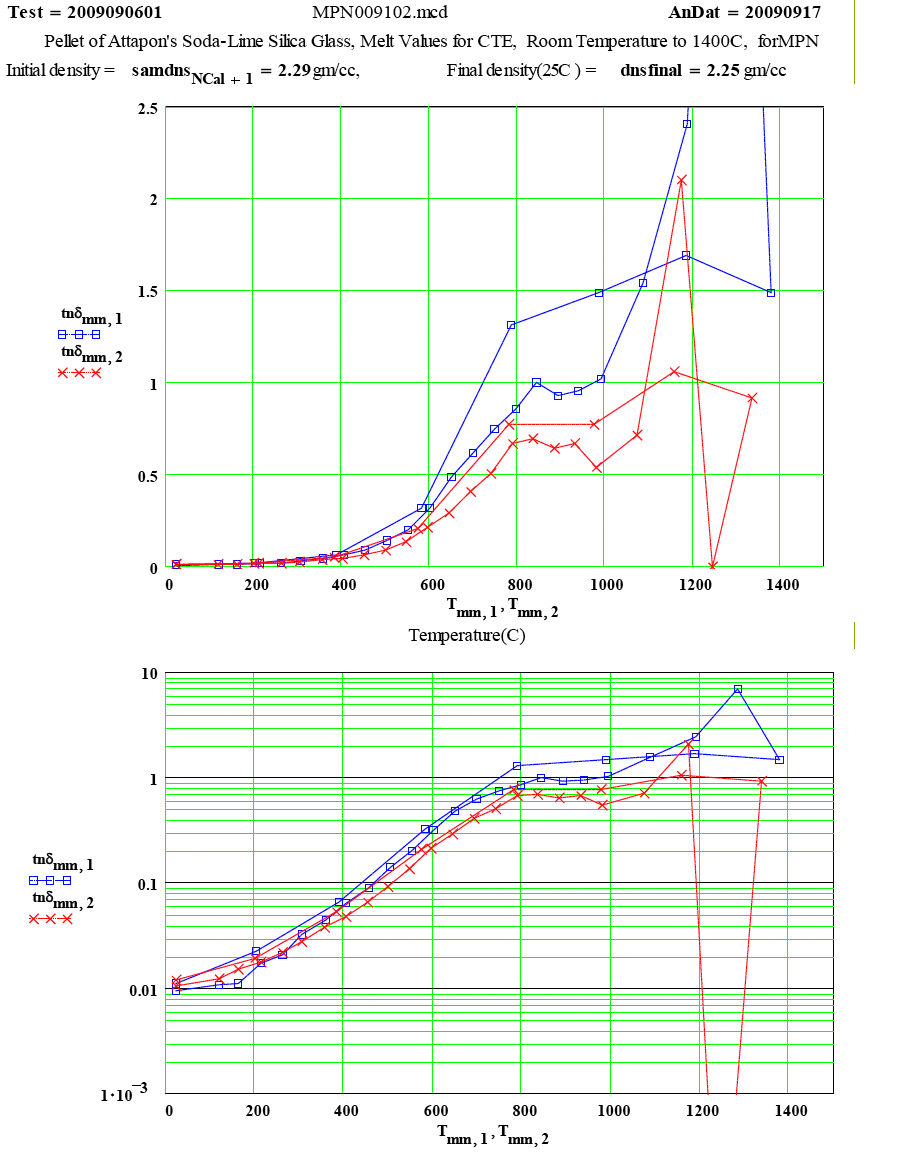
| The measured values of tanδ as a function of temperature. The obvious error in epp at 1250ºC should be neglected. |
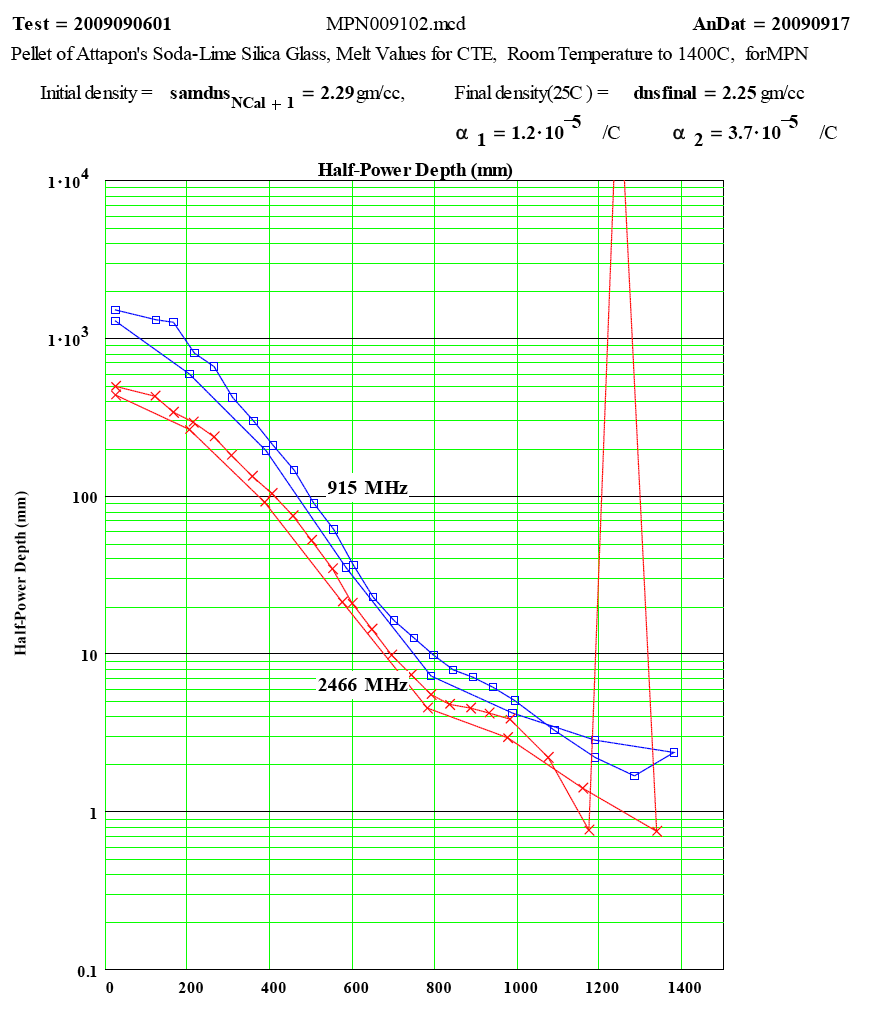
| The measured values of Half-Power Depth, as a function of temperature. For values less than 4mm, the data analysis is increasingly inaccurate. |
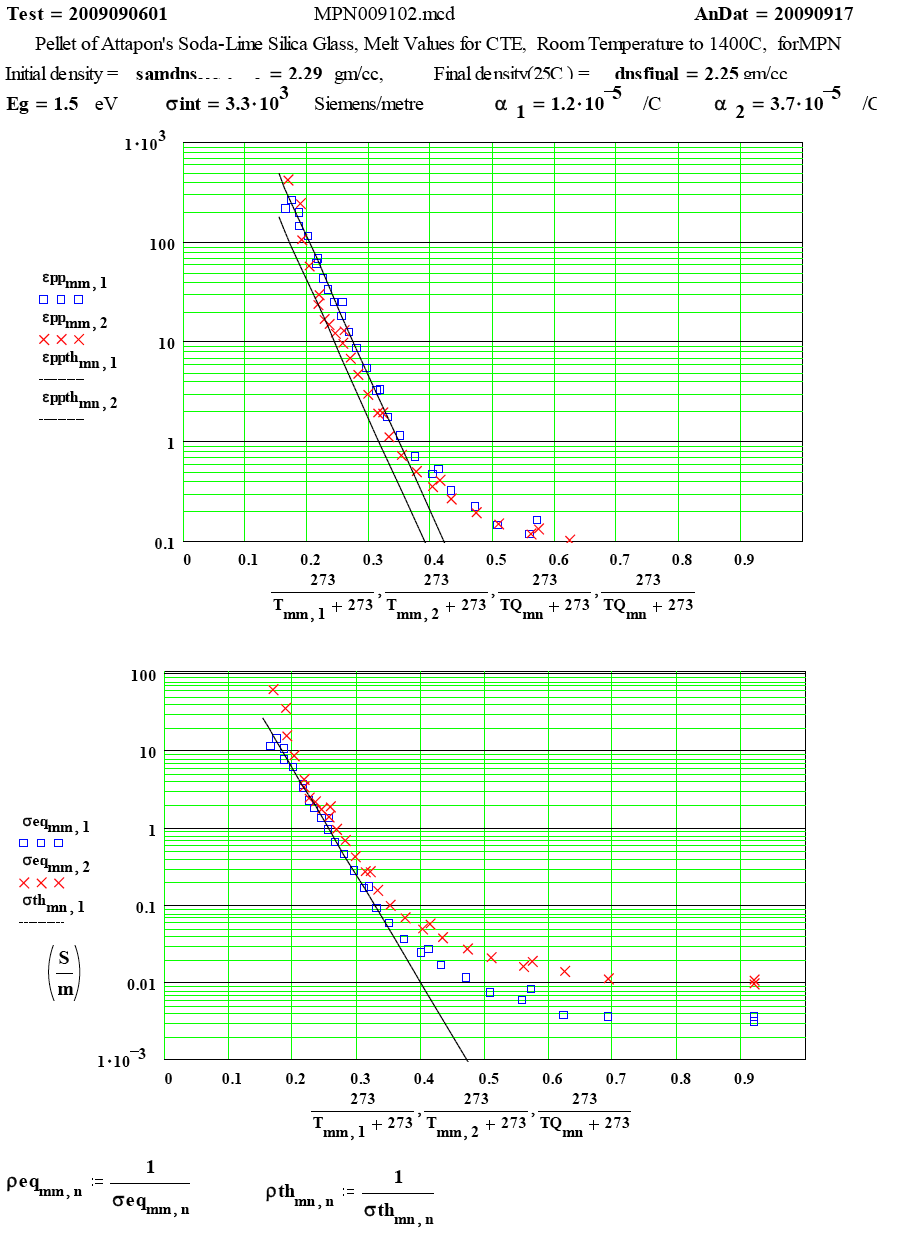
| The Arrhenius plots show that the loss mechanism is thermally activated, but the ratios of the two frequency values is not correct for the mechanism to be simple free-electron conductivity, except possibly at the highest temperatures! |
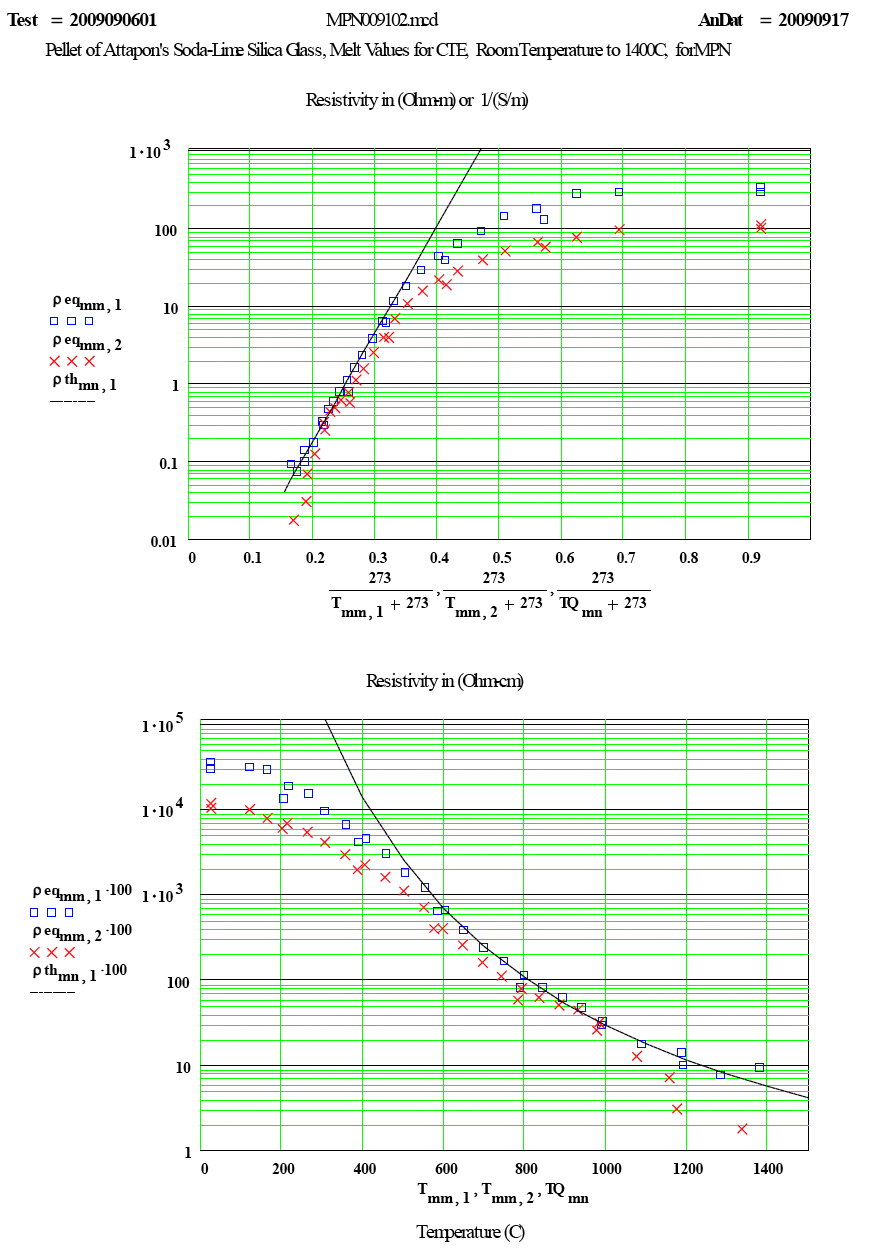
| The measured values of “equivalent resistivity” as a function of temperature. |
Please feel free to phone or e-mail and discuss possible measurements. We treat all communications as confidential unless advised otherwise.